

THE IN VIVO PROLIFERATION KINETICS OF HUMAN SOLID TUMOURS.
A thesis submitted to the University of Cambridge for the degree of Master of Surgery
by DAVID ANTHONY REW, MA MB BChir FRCS Pembroke College, Cambridge 1975-78
The University Surgical Unit, Southampton General Hospital, Tremona Road, Southampton S01 6HU
March 1990
Cite: The in vivo proliferation kinetics of human solid tumours
Rew, D., 1 Jun 1991, Cambridge: University of Cambridge. 251 pp.
The last decades of the nineteenth century were ... occupied with the detailed study of the morphology of tumours, the separation of the varieties of disease, the elucidation of histogenesis and the writing of the natural history of malignant diseases. The twentieth century opens as the experimental era with the systematic study of tumours throughout the animal kingdom. It seems likely to become noteworthy as the period of specific aetiological investigations which promise to widely separate many neoplastic diseases formerly held to be closely related. It may, thereby, prove to be the era of successful therapeutics and prophylactics.
- James Ewing
in: Neoplastic Diseases. Philadelphia: WB Saunders and Co., 1919.
SHORT SUMMARY
The study of tissue and tumour cell kinetics is one approach to better understanding of human tumour biology and to the formulation of better treatment strategies. Past efforts to measure in vivo the duration of cell cycle phases has been severely handicapped by the need to use radioisotopes and to take sequential biopsies. The drug 5-bromo-2-deoxyuridine (BRdU) is a safe, ethical alternative to tritiated thymidine for in vivo labelling of DNA during the S phase of the cell cycle. The label can be detected by conventional histochemistry, and by multiparameter flow cytometry. The latter provides measurements of ploidy, phase related DNA labelling, and the duration of the S phase and of the potential doubling time (Tpot) of the tumour or tissue. These parameters have not been characterised in many types of tumour, nor have their relationships to prognosis or to treatment strategies been explored.
A series of 100 colorectal adenocarcinomas, 53 invasive ductal carcinomas of the breast, 35 gastrooesophageal carcinomas and a small number of lymphomas, melanomas, sarcomas and squamous carcinomas were studied prospectively. Hospital ethical committee approval and informed patient consent was obtained for a single intravenous injection of 250mg BRdU prior to conventional surgery for malignant disease. The DNA index, total and aneuploid labelling indices, S phase duration and Tpot were measured. No correlations were found to exist between these parameters and current prognostic indicators. Long term follow-up will be undertaken to relate the data to clinical outcome.
The Tpot of gastrointestinal tumours was typically less than ten days, whereas the actual volume doubling time from clinical experience is known to be of the order of 100 days or more. This discrepancy is largely produced by a high rate of cell loss by exfoliation and necrosis in these tumours. A validation study of the Tpot concept was undertaken using the
A study was undertaken of mucosal kinetics using tissue from resection specimens throughout the gastrointestinal tract. An original method is described for the calculation of the crypt labelling index and crypt cell turnover rate combining histological and flow cytometric data. A good correlation was obtained with previously published data. The method offers advantages over previous methods of studying mucosal kinetics in normal and disease states.
The counting of confluent features of interest such as labelled nuclei in stained tissue sections is laborious and prone to observer errors. An original application of the automated planar image analyser is described which allows automation of the measurement of the labelling index in peroxidase stained tissues. This has a number of uses in clinical research in histopathology.
A reliable intrinsic marker of tumour proliferation would offer substantial practical advantages over BrdU labelling. The "p62" protein product of the putative oncogene c-myc was measured by multiparameter flow cytometry in colorectal tumours and tissues. Results were compared with BrdU labelling in the same specimens. p62c-myc levels were found to be unexpectedly high in normal and polyposis coli mucosa, raising new questions about the function of the c-myc gene.
The combination of in vivo BrdU labelling and multiparameter flow cytometry has been demonstrated to be valid and practical in the study of tumour and tissue kinetics. The possible use of the technique in devising better chemotherapy and radiotherapy regimes are discussed. Future lines of research are considered.
STATEMENT OF ORIGINALITY
This thesis describes the original work and ideas of the author. Clinical material was selected and collected by the author with the exception of some breast tumours which were collected by Mr Ian Campbell, Research Fellow at the University Surgical Unit, Southampton. Flow cytometry of bromodeoxyuridine labelled tissues was performed under the supervision of Dr. George Wilson. The analyses of the p62c-myc protein were performed under the supervision of Dr Jim Watson and Miss Hilary Cox. Invaluable suggestions were assimilated from many clinical, scientific and technical colleagues.
STATEMENT OF ETHICS
Hospital Ethical Committee approval was obtained separately from the Portsmouth and the Southampton Hospitals ethical committees before the study. All patients studied gave informed consent prior to a single intravenous injection of bromodeoxyuridine before surgery.
All procedures involving animals were carried out humanely under ether anaesthesia. Animals were maintained under normal regulatory procedures in the Animal House, Southampton University.
PUBLICATION
The work described in this thesis has not been previously published other than in Abstract form in the British Journal of Surgery, Proceedings of the Surgical Research Society meeting in Liverpool, January 1990 (in press).
ACKNOWLEDGEMENTS
This Thesis would not have been possible without the support of the many clinicians and scientists who have given generously of their time, advice and resources. Mr. Paul C Weaver, MD FRCS gave his wholehearted support to the proposal for this project while I was his Registrar at St. Mary's Hospital, Portsmouth and provided much advice subsequently. The idea was derived from a lecture by Professor Julie Denekamp PhD, Director of The Gray Laboratory of the Cancer Research Campaign. Dr. Nic McNally PhD, Head of the Department of Cell Biology and Dr. George Wilson PhD welcomed me as an ex officio member of their group at the Gray Laboratory and taught me the intricacies of their subject. Miss Christine Whitsed, BSc, Laboratory Scientist provided helpful technical support.
Professor Irving Taylor, MCh FRCS kindly guided and supervised the project with a generous freedom of movement from the University Surgical Unit, Southampton, and made available the resources and experience of his Department. Dr. Alan Cooper provided much help with the animal experiments.
Mr. Michael Thompson, MD FRCS and Mr. Colin Johnson MChir FRCS, provided access to their patients. Dr. Rose Buchanan, MRC Path, Consultant Pathologist and Mr Robert Stradling, MLSO, provided histological expertise at St Mary's Hospital.
Dr Jim Watson directed the studies on the c-myc protein at the Hills Road, Cambridge Laboratory of the Medical Research Council. Miss Hilary Cox, Technical officer, provided much additional help. Ms. Elizabeth Adam and Professor Mayer provided advice and facilities at the Section of Human Morphology, University of Southampton for the studies described in Chapter 5.
vi.
Funding for my salary was provided by The Cancer Research Campaign. The Wessex Regional Health Authority Research Committee funded the purchase of drugs and other expenses with a generous grant. Additional costs were kindly borne by the Gray and Hills Road Laboratories. Dr Chris Dean of the ICRF Hybridoma Unit, Royal Marsden Hospital, Sutton kindly supplied the anti BRdU monoclonal antibody.
I am indebted to all patients who consented to partake in this experimental work. Without them no progress would have been made.
This thesis was prepared and typed by the author on an Amstrad 1640 Personal Computer with a Hard Disk facility. Word processing, database and spreadsheet operations were performed using the SMART software package Version 2, (Innovative Software Inc., 1986). Statistical procedures were performed using Statgraphics software (STSC Inc., Maryland, USA). The graphics were prepared using Harvard Graphics (Software Publishing Corporation, USA). Dr John Francis of Southampton University Haematology Department provided valuable advice on the use of the software. Other illustrations were prepared at Southampton General Hospital Teaching Media Department.
I am indebted to my wife Victoria for her help with the preparation of the manuscript.
CONTENTS
Title Page
Quotation
Short Summary
Statements of Originality and Ethics
Acknowledgements
Index of chapter contents
List of Tables, Figures and Appendices
Glossary of abbreviations
CHAPTER 1. INTRODUCTION AND LITERATURE REVIEW.
Sections 1:1:1-11.
Cell cycle theory and historical methods of measurement.
Sections 1:2:1-16.
The measurement of cell kinetics using BRdU and flow cytometry.
Pages 1:1-39
CHAPTER 2. IN VIVO PROLIFERATION OF COLORECTAL CARCINOMAS.
2:1. Chapter abstract.
2:2. Proliferation in human colorectal carcinomas
2:3. Materials and methods.
2:4. Results.
2:5. Discussion.
2:6. The Tpot in an animal model.
Pages 2:1-41
CHAPTER 3. PROLIFERATION IN COLORECTAL MUCOSA AND ADENOMAS.
3:1. Chapter abstract.
3:2. Introduction.
3:3. Materials and methods.
3:4. Results.
3:5. Discussion.
Pages 3:1-17
CHAPTER 4. THE PROLIFERATION OF GASTRO-OESOPHAGEAL CARCINOMAS AND MUCOSA.
4:1. Introduction and literature review.
4:2. Materials and methods.
4:3. Results
4:4. Discussion.
Pages 4:1-16
CHAPTER 5. AUTOMATED ANALYSIS OF IMMUNOPEROXIDASE STAINING.
5:1. Introduction.
5:2. Materials and methods.
5:3. Results
5:4. Discussion.
Pages 5:1-10
CHAPTER 6. THE IN VIVO KINETICS OF HUMAN BREAST CARCINOMAS.
6:1. Introduction and review
6:2. Materials and methods.
6:3. Results.
6:4. Discussion.
Pages 6:1-17
CHAPTER 7. IN VIVO PROLIFERATION OF OTHER HUMAN TUMOURS.
7:1. Introduction.
7:2. The brain and central nervous system.
7:3. Squamous carcinomas of the head and neck.
7:4. Adenocarcinoma of the lung
7:5. Malignant melanoma
7:6. Transitional cell carcinoma of bladder
7:7. Lymphomas
7:8. Other tumours, including sarcomas.
7:9. Conclusions.
Pages 7:1-10
CHAPTER 8. MEASUREMENT OF THE C-MYC GENE PRODUCT.
8:1. Introduction.
8:2. Materials and methods.
8:3. Results.
8:4. Discussion.
Pages 8:1-22
CHAPTER 9. DISCUSSION: APPLICATIONS OF IN VIVO KINETICS.
9:1. Introduction.
9:2. Cell cycle kinetic data applied to therapy.
9:3. Chemotherapy.
9:4. Radiotherapy.
9:5. Conclusions.
Pages 9:1-14
APPENDICES
Pages A:1-19
REFERENCES
Pages R:1-32
List of Tables
1:1. Comparison of BrdU and thymidine labelling.
2:1. Historical data on labelling indices of human colorectal cancer.
2:2. The numbers of multiple specimens studied from colorectal tumours.
2:3. Colorectal tumour kinetic data: results.
2:4. The kinetics of primary tumours and metastases.
2:5. Intratumour variation in kinetic data.
2:6. Tumour xenograft kinetic data from animals.
2:7. Volume growth and kinetic data for the MC28 rat sarcoma cell line grown in nude mice.
3:1. Historical data on the labelling indices and kinetics of human colorectal mucosa.
3:2. The crypt labelling index and cell turnover rate. Results from human in vivo data.
3:3. Comparison of the labelling index by crypt cell counting and flow cytometry.
4:1. Kinetic data results for the series of gastro-oesophageal tumours.
4:2. The kinetic data of gastric adenocarcinomas sorted by histological grade.
4:3. Kinetic data from gastro-oesophageal mucosa.
5:1. Example of data comparing planar image cytometry and manual counting of peroxidase labelled cells.
5:2. An application of planar image cytometry to measure nuclear size.
6:1. Historical data on human breast tumour kinetics.
6:2. Kinetic data results for human breast carcinomas in relation to node status.
6:3. Intratumour variation of breast tumour kinetics.
7:1. Historical data on the labelling indices of various human tumours.
7:2. Measured kinetic data from seven lymphomas.
7:3. Measured kinetic data on other human tumours.
8:1. p62c-myc in colorectal tumours and tissues.
List of Figures
1:1. Diagram of the cell cycle (after Tubiana 1971).
1:2. Concept of the potential doubling time.
1:3. Cell metabolism of pyrimidine analogues.
1:4. The principle of multiparameter flow cytometry.
1:5. Excitation and emission spectra of dyes.
1:6a. The gating of diploid histograms.
1:6b. The gating of aneuploid histograms.
1:7. The principle of BRdU detection with antibodies.
1:8. The concept of relative movement.
1:9. Cycle progression in a mouse tumour model.
2:1. Flow chart of colorectal tumour kinetic analysis.
2:2. Cytometry histograms of a diploid colonic tumour and mucosa.
2:3. Cytometry histograms of an aneuploid colonic tumour.
2:4. An example of intra-tumour variation in kinetic data.
2:5. The range of ploidy of 52 aneuploid tumours.
2:6. The intratumour variation of DNA content.
2:7. A comparison of the total and aneuploid labelling indices in colorectal carcinomas.
2:8. Intra-tumour variation in the total labelling index.
2:9. Duration of the S phase in diploid and aneuploid tumours.
2:10. Intra-tumour variation in the S phase duration of colorectal carcinomas.
2:11. The range of the potential doubling time in diploid and aneuploid tumours.
2:12. Intra-tumour variation in the Tpot of colorectal carcinomas.
2:13. The relationship of the total labelling index to tumour grade and Dukes stage.
2:14. The relationship of the potential doubling time to tumour grade and Dukes stage.
2:15. A comparison of BRdU labelling of colorectal carcinomas by flow cytometry and counting.
2:16. The volume growth curve of the MC28 sarcoma.
2:17. Photomicrograph of a colonic tumour labelled with BRdU.
2:18. Photomicrograph of a colonic tumour labelled with BRdU.
3:1. Diagram of the measurement of mucosal kinetics by flow cytometry.
3:2. Diagram of the comparison of kinetics of mucosa at various distances from the primary tumour.
3:3. Photomicrograph of BRdU labelled colonic mucosa.
3:4. Photomicrograph of a BRdU labelled villous adenoma.
3:5. Photomicrograph of BRdU labelled colonic mucosa from a patient with polyposis coli.
3:6. Photomicrograph of labelled colonic mucosa from a patient with polyposis coli
3:7. Results for the crypt labelling indices of mucosa compared with adenomas and carcinomas.
4:1. Cytometry histograms of normal gastric mucosa and a diploid carcinoma.
4:2. Cytometry histograms of an aneuploid gastric carcinoma and a metastatic lymph node.
4:3. The kinetic data for upper gastrointestinal tumours.
4:4. The kinetic data for upper gastrointestinal mucosa.
4:5. Photomicrograph of labelled squamous mucosa.
4:6. Photomicrograph of labelled gastric mucosa.
4:7. Photomicrograph of a labelled squamous carcinoma.
4:8. Photomicrograph of a poorly differentiated gastric carcinoma.
5:1. Flow diagram of the method of assessing the planar image cytometer.
5:2. The design of the image processing cytometer.
5:3. The processed images generated by the image cytometer.
5:4. Comparison of manual and image processed labelling indices.
6:1. The analysis of breast tumour kinetics.
6:2. Photomicrograph of a BRdU labelled breast carcinoma.
6:3. Photomicrograph of a BRdU labelled breast carcinoma metastasis.
6:4. Photomicrograph of a BRdU labelled breast carcinoma.
7:1. Photomicrograph of a BRdU labelled cutaneous melanoma.
7:2. Photomicrograph of a BRdU labelled rectal melanoma.
7:3. Cytometric histograms of head and neck tumours.
7:4. Histograms comparing kinetic data from various human tumours.
8:1. The staining procedure for the p62c-myc protein.
8:2. Cytometry histograms of tumour p62c-myc content.
8:3. p62c-myc levels in colorectal tissues and tumours
8:4. Results: p62c-myc levels in colorectal tissues and tumours compared with BRdU labelling.
8:5. Results: p62c-myc levels in colorectal tissues and tumours compared with the Tpot.
8:6. Photomicrograph of polyposis coli mucosa stained for p62c-myc protein.
8:7. Photomicrograph of polyposis coli mucosa stained for p62c-myc protein.
9:1. A theoretical model of conventional radiotherapy applied to colorectal tumour kinetic data.
9:2. A theoretical model of C.H.A.R.T. radiotherapy applied to colorectal tumour kinetic data.
List of Appendices.
2:A. The histopathology data, DNA index and Tpot data on 100 colorectal carcinomas.
2:B. The labelling index, Ts, Relative Movement data and tumour sizes of 100 colorectal carcinomas.
2:C. The immunohistochemical staining procedure for BRdU labelled tissue sections.
3:A. The kinetic data for ileal, colonic and rectal mucosa, metaplastic polyps and villous adenomas.
4:A. The kinetic data for gastro-oesophageal tumours.
4:B. The kinetic data for gastric and oesophageal mucosa.
4:C. The kinetic data compared from primary gastric carcinomas and their associated metastases.
6:A. The kinetic data from primary and metastatic breast carcinomas.
8:A. The p62c-myc content and BRdU labelling data compared in colorectal tumours and mucosa.
GLOSSARY OF ABBREVIATIONS
BRdU 5-Bromo-2-deoxyuridine (Bromoxuridine)
CCTR Crypt Cell Turnover Rate
CEA Carcino-embryonic Antigen
CHART Continuous, Hyperfractionated, Accelerated Radiotherapy
DI DNA Index (ploidy)
EGF(R) Epidermal Growth Factor (Receptor)
ER Oestrogen Receptor
FACS Fluorescence Activated Cell Sorting
FAP Familial Adenomatous Polyposis
FCM Flow Cytometry/ Flow Cytometer.
FITC Fluorescein
FLM Fraction of Labelled Mitoses
5FU 5-Fluorouracil
FUdR Fluoro-deoxyuridine
GF Growth Fraction
IBAS Interactive Biological Analysis System
IUdR 5-Iodo-2-deoxyuridine
LI Labelling Index
MDR Multi-Drug Resistance
PBS Phosphate Buffered Saline
PCNA Proliferating Cell Nuclear Protein Antigen (Cyclin)
PDGF Platelet Derived Growth Factor
PI Propidium Iodide
PMT Photomultiplier Tube
RAMIG Rat anti-mouse Immunoglobulin
RM Relative Movement
SPF S Phase Fraction
Tc Cell Cycle Time
3H-Thy Tritiated Thymidine
TLI Thymidine Labelling Index
Tpot Potential Doubling Time (Apparent Cell Cycle Time)
Ts Duration of the S phase
Vd, Td Volume/Tumour Doubling Time
CHAPTER 1
1:1:1. Introduction
The unifying theory of cell kinetic activity is the Cell Cycle concept, which describes the life cycle of individual cells. Until recently, it has not been possible to measure cell cycle kinetic data in vivo in ethical clinical practice except in unusual circumstances using radioisotopes. The experimental work which has been performed in animals and in vitro systems may not always apply to human in vivo biology. Tumour growth occurs both in space and in time, at the tissue, organ and cellular level. Tumour growth can be measured in clinical practice by a variety of physical and radiological methods. A better understanding of in vivo cell growth is desirable, and may have unforeseen applications. The questions as to whether in vivo cell kinetic data might be used to improve chemotherapy and radiotherapy, and to calculate prognostic indices, have remained unanswered.
Malignant disease in all its forms is a major cause of human morbidity and unpleasant death. With few exceptions, the effect of recent improvements in treatment by surgery, radiotherapy and chemotherapy on life expectancy have been incremental rather than dramatic. The flourishing of molecular biology and computer technology opens new avenues for investigation of tumours at the subcellular level. One path to better understanding may be through cell kinetics. A technique has recently been reported by which tissue and tumour biopsy material obtained in the normal course of clinical investigation from patients with haematogenous or solid tumours can rapidly and safely be studied to obtain quantitative measurements of cell cycle parameters. This has clinical potential. The technique has been made possible by developments in a number of scientific fields. The flow cytometer (FCM) links computer and laser technology to enable the accurate counting, separation and collection of large numbers of fluorescent-labelled single particles from heterogenous cell populations in suspension.
This has been supported by the development of mathematical models and computer software to analyse the cell cycle and the behaviour of populations of living cells. Biotechnology has provided monoclonal antibodies directed against selected drugs and other organic molecules. Pharmacologists have produced substituted DNA precursor molecules, including the halogenated pyrimidines such as 5-bromo-2-deoxyuridine, (Bromoxuridine, BrdU). The use of these advances in a practical method of cell kinetic analysis will be described in this chapter. This method will be subsequently referred to as the FCM/BrdU method.
Using this method, I have elected to study in detail the in vivo cell kinetics of human colorectal, gastrooesophageal and breast tumours, all of which are common in a General Surgical unit. Preliminary studies have been performed on a range of other solid tumours, including malignant melanomas and transitional cell carcinoma of the bladder. The state of cell kinetic knowledge for each tumour type will be reviewed and discussed in the appropriate chapter. In this study a number of questions about the cell cycle in human solid tumours and non-malignant tissues have been addressed.
- Are the cell cycle kinetics of human tissues and tumours of a particular origin, size or grade constant, or do they vary widely?
- If the in vivo cell cycle kinetics are variable, do they vary from individual to individual, with pathological class, description or grade, with time during the growth of the tumour, at different sites within the primary tumour or between the primary tumour and metastases?
- Can premalignant changes be detected in the tissue of origin of the primary tumour, particularly gastrointestinal mucosa, and are there changes in the growth characteristics of normal mucosa with anatomical site along the gastrointestinal tract?
- Is the technique of practical value in clinical use to give an improved assessment of prognosis or to allow optimum planning of individual radiotherapy or chemotherapy?
treatment schedules? - Is the technique accurate, reproducible and consistent, and what are the sources and ranges of error?
- What other features of tumour cell biology are amenable to study using similar methodology? For example, it is possible to compare kinetic data derived from BrdU labelling with the expression of intrinsic proliferation associated antigens and oncogene products, such as the c-myc gene product.
- Is it possible to adapt the technique to cell/tissue culture and animal models to study chemotherapeutic agents?
1:1:2. The concept of the cell cycle.
The theory of cell and tissue kinetics has been reviewed by Steel (1977), Wright and Alison (1984) and Pardee, Laskey, Murray, McIntosh and Hartwell (1989). An outline review of cell cycle theory and related concepts relevant to this project is described here. The concept and terminology of the cell cycle was introduced in 1951 by Howard and Pelc. All proliferating prokaryotic and eucaryotic cells are believed to follow a lifespan from inception to division through a series of stages known collectively as the cell cycle. The importance of the cell cycle concept is that cell populations become amenable to mathematical and statistical analysis. The phases are G1 (Gap 1) from which cells may enter the G0 (Resting phase), or the S (DNA Synthesis) phase, and then the G2 (Gap 2) phase, from which cells pass into the M (Mitosis) phase. Chromosomes are duplicated during the S phase. The timing of S, G2 and M phases is believed to be relatively constant for any one cell type, maximum variation being found in the duration of the G1 phase.
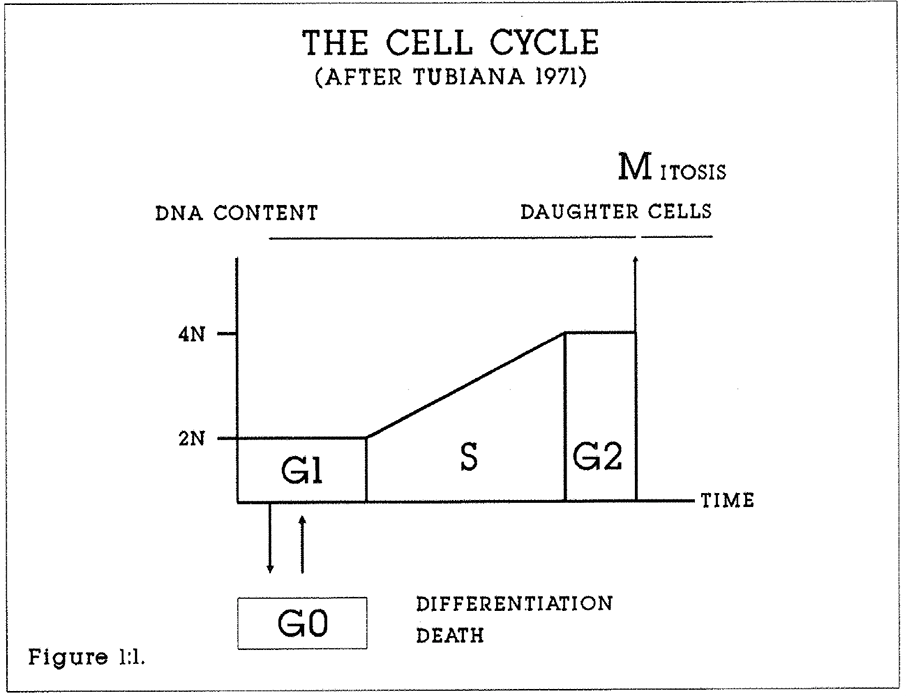
Figure 1:1. The cell cycle is often depicted in circular form. This diagram emphasises the change in DNA content through the cycle. Each daughter cell reenters G1 after Mitosis.
A cell in the G1 phase possesses a single, diploid set of chromosomes. Not all cells leave the G1 phase. Cells may become specialised in G0. Cells are also lost through malfunction, necrosis and external factors such as drug treatment. In most cell systems, the majority of cells are in G0. DNA synthesis is greatest during the S phase of the cell cycle. The synthesising cell incorporates exogenous purine and pyrimidine bases or their artificial analogues into the cellular DNA. By supplying cells with radiolabelled or synthetic precursors of DNA, either by pulse labelling or by continuous labelling, it is possible to calculate the proportion of cells in a tissue sample which are in the S phase, the S Phase Fraction (SPF), the duration of the S phase (Ts), and the proportion of cells in the population expressing the marker of interest, or labelling index (LI). From this primary data the duration of the cell cycle (Tc) and the potential doubling time (Tpot) of the tissue or tumour can be estimated. These concepts are collectively
referred to as the Cell Kinetic Data of the cells. The ways by which this data can be generated and analysed mathematically will be described.
The basic concept of the cell cycle has been refined by different authors. For example, Ronot and Adolphe, (1986) have postulated distinct cell growth cycle and DNA Division cycles. According to their theory, the cell cycle may be subdivided into two distinct synthetic components, possibly under independent regulatory control. These are the DNA replication (Nuclear cycle) and the cytoplasmic and organelle replication (Growth cycle), measured by RNA and protein accumulation. These two components are usually closely linked, but cell growth through cytoplasmic expansion may proceed without cell division (Baserga 1984). The components may be "dissected" by selective block of DNA synthesis by drugs such as cytosine arabinoside (Ara-C) which induces S phase arrest, or by simultaneous flow cytometric analysis of DNA/RNA and DNA/Protein content.
Such studies suggest that there are subdivisions of the G1 and G2 phases according to the progress of RNA and protein synthesis, and that Quiescent, Transitional and Differentiated states may be further distinguished by their relative DNA, RNA and protein contents. However, the fundamental integrity of the cell cycle concept has not been challenged by such work.
1:1:3. The growth rate of tissues.
Three important parameters affect the rate of growth of a tissue or tumour (Figure 1:2). They are:
- The growth fraction, which is the proportion of proliferating cells in the population.

- The duration of the cell cycle Tc. If all cells are dividing, the time taken for the population to double its numbers will be the cell cycle time. The specific growth rate of a tissue or tumour is referred to as the Doubling time (Td or Vd), which usually refers to volume but may also be a mass or a linear measurement (e.g. cell/cell/hr).
- The cell loss factor, comprising cell death and cell exfoliation into the bloodstream, lymphatics, body cavities or gastrointestinal tract. Cell loss from tissues and tumours may occur for a number of reasons, including natural cell death (ageing and apoptosis), cell migration or metastasis, immunological reactions, drug or radiation effects, or devascularity.
In any cell population, GF is usually less than 100% or unity. Because of this, the time taken for a population of cells to complete a cell cycle is longer than if all cells were active and dividing in unison. In other words, The Potential Doubling Time (Tpot), otherwise known as the Apparent cell cycle time is only equal to the Cell Cycle Time (Tc), if GF = 1.0. Td is the product of the cell cycle time Tc and the Growth Fraction (GF), if there is no cell loss.
The true pattern of growth of tumours from single abnormal cells to advanced disease is not known. In some experimental models, growth is initially exponential but decays with time, such as in the Gompertz Growth Equation (Laird 1964). The macroscopic growth rate of human tumours probably varies with time according to the interaction of tumour factors such as cell inhibition and host factors such as the inflammatory response, nutrition and the tendency to outgrow the blood supply (Denekamp 1986). The question of whether the Cell Cycle Time varies during the course of the disease is less certain. Deschner and Lipkin (1976) have provided evidence that Tc is relatively constant in gastrointestinal mucosa, ulcerative colitis and neoplasia.
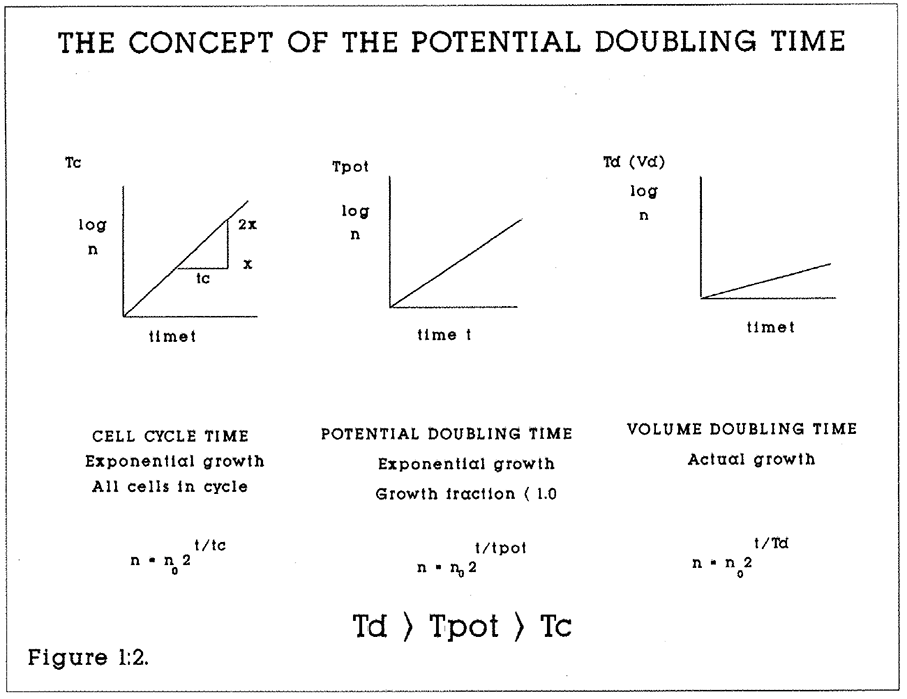
Figure 1:2. The mathematical relationships of the potential doubling time, the cell cycle time and the actual volume doubling time are shown. n is the number of cells and t is the time (hours or days).
1:1:4. Controls of the cell cycle and of cell proliferation.
Howard and Pelc’s original model of the cell cycle has been refined by new experimental methods in biochemistry, molecular biology, biomathematics and flow cytometry. (Ronot and Adolphe, 1986). It is believed that the duration of the S, G2 and M phases are relatively constant. The control of cell cycle duration appears to reside in G1. The relationship between the active and quiescent states in G1 is uncertain. For example, Epivanova and Polunovsky (1986) propose that the transition between these states is the result of an interaction between intra- and extracellular molecules, according to the relative concentrations of various molecules. The molecular regulation of cell proliferation and differentiation is undoubtedly complex. It may involve both external signals acting at the cell membrane, and intracellular signals.
Certain "switch" molecules might control the duration of the cell cycle and the fate of the cell at various points, for example to proceed to meiosis or mitosis, to remain in a transient or permanent resting phase prior to the S phase, or to proceed to further differentiation. Progression to S phase may require a series of switches. Evidence for the existence of such switches has been reviewed by Prescott (1982) and Zetterberg (1982). Many molecules, for example Platelet Derived Growth Factor, (PDGF), insulin and glutamine will stimulate proliferation of cultured quiescent 3T3 cells. In order to prove that a particular molecule is a regulator of the cell cycle, it is necessary to demonstrate that it is synthesised by or available to the cell in appropriate temporal relationship to the effect. Experimentally applied, purified molecule should produce the same effect, either directly or by gene activation or deactivation. Mutant or drug-treated cell lines which lack the appropriate gene or molecular mechanism should be unable to pass to the next phase of the cell cycle. For example, when RNA Polymerase II is blocked by &-amanitin, BHK cells are unable to enter the S-phase. The list of candidates for these controls include molecules which may be present in very small numbers and with selective expression varying with time, such as:
-serum peptides, hormones and proteins acting as growth factors and growth factor receptors at the cell membrane, for example the Platelet Derived Growth Factor (PDGF) and Epidermal Growth Factor (EGF).
-endocellular molecules within the cytoplasm or cell nucleus.
The role of growth factors, inhibitory factors, genes and gene products in the control of mammalian cell proliferation has been reviewed by Baserga, 1982, Denhardt 1986, and Lloyd 1987. Use has been made of the haemopoietic system to determine the controls of the cell cycle. Lord (1986) concluded that the proliferation both of stem cells and of maturing populations depends on inhibitory and stimulatory molecules (such as erythropoietin) which act through negative feedback loops.
1:1:5. Proliferation associated proteins.
Selective gene activity may be studied by analysing protein expression during the cell cycle. Such proteins may be used to measure the cycle kinetics, as indicators of the effectiveness of therapy and of prognosis. The Restriction point (R) model for cell cycle control in G1 proposes that commitment beyond R requires the synthesis of a labile (growth factor induced) protein (Pardee 1974). A number of PDGF induced candidate molecules have been proposed (Denhardt 1986). Lee and Nurse (1987) have identified a human protein acting early in G1 which commits cells to the mitotic cycle. Some proteins already have a well recognised cycle dependent expression and a defined function. These include:
- Histones, complexed with eukaryotic DNA.
- Enzymes of nucleotide and polyamine metabolism such as dihydrofolate reductase and Thymidine kinase.
- Cyclin, proliferating cell nuclear protein antigen (PCNA), a 36,000 MW acidic protein which increases in the late S phase. Garcia et al (1989) have reported the use of Monoclonal Antibody 19A2 (Ogata et al, 1987) on formalin fixed, deparaffinised sections of human tumours with successful demonstration of proliferating cells in tumours and gastrointestinal mucosa.
- Secreted proteins such as Interleukin-2, Collagen and Interferons. These substances may also affect growth by effects on the vascularity of a tumour.
-Protein p105 (Bauer and Clevenger, 1985) is selectively expressed in G0 and M phases, and differentially between well and poorly differentiated areas of human colonic adenocarcinoma.
-DNA Polymerase alpha increases during the cell cycle, but is confined to the nucleus during the S phase. A monoclonal antibody is available, and has been used to evaluate expression in colon cancer cell lines by both immunoperoxidase staining and FCM (Alama, 1987; Stokke 1988).
-A labile proliferation associated protein recognised by the Ki67 monoclonal antibody is expressed in the nucleus of proliferating cells but not in resting cells. The antigen is maximally expressed in late S and the G2M phases. (Gerdes et al 1983, 1984). Sasaki et al (1988) showed that its activity in HeLa S3 cells was abolished by DNAse 1 but not RNAse, suggesting that it is bound to DNA. Expression was increased by blocking DNA synthesis with hydroxyurea and adriamycin. Its biological function remains unknown. The Ki-67 growth fraction or labelling index may be useful as a guide to treatment or prognosis in human malignancy, particularly breast carcinoma (vide infra). Ki-67 can be measured by immunohistochemistry and by FCM. For example, Schwarting (1986) determined the Ki-67 growth fraction of peripheral blood monocytes by FCM. The relationship between labelling indices measured by Ki-67 and by BrdU labelling in human tumours has been explored by Sasaki et al (1988). They compared the LI of 20 randomly selected human malignant tumours. The Ki-67 LIs were 1.9-37.5% and the in vitro BrdU LIs were 1.6-23.4%. In general the measurements paralleled each other.
Multiparameter FCM can also be used to study protein expression during the cell cycle. For example, Rice et al (1986) studied heat shock protein expression in the various phases of the cycle of CHO fibroblasts. BrdU incorporation and DNA content were measured in an assay of the response of these cells to cycle enhancing and delaying stimuli.
1:1:6. Control of the tumour cell cycle.
What kinetic features may distinguish malignant cells from normal cells? Tumour cells may exhibit uncontrolled growth, abnormalities of shape, metabolism, synthesis and distinctive surface membranes and antigenicity. The comparison of the growth of normal and tumour cells in culture is a way of identifying the molecular regulators. This plethora of abnormal traits may be caused by relatively simple or limited genetic changes. For example, Pardee (1982) showed that there is an accumulation of the labile p53 protein in the G1 phase in the SV40 virus transformed 3T3 cell line. This protein may be more rapidly accumulated or more slowly degraded. A single mutation in the ras oncogene in human bladder carcinoma cells, substituting a valine for a glycine amino acid in a 21,000 Molecular Weight protein, is believed to elicit profound changes in the behaviour of the protein in the cell (Weinberg 1983).
Tumour cells pass through mitotic cell cycles in the course of tumour growth as do non-malignant cells, although the specific cell cycle controls may be modified as a result of the malignant process. Quantitative measurements can be made on individual tumours using mathematical models of the cell cycle. Cancer cells do not necessarily divide more rapidly than normal cells, but their controls to growth may be abnormal. For example, Camplejohn et al (1973) and Wright et al (1977) have suggested that the cell production rate of colorectal and gastric carcinomas respectively may be less than in the mucosa of origin.
1:1:7. Tumour clonality and its significance.
Are tumours homogenous or heterogenous populations of cells? In general, the cells of solid tumours are believed to be monoclonal and derive from a single mutated stem cell line and share similar behaviour and antigenic markers with each other. Liu and Wright (1986) examined a mathematical model of cutaneous tumour growth which led them to conclude that clonal proliferation of a single neoplastic cell would
continue indefinitely. Camplejohn (1982) described the role of stem cells in colonic mucosa. Their existence and location in malignant tissues is difficult to prove. Stem cells may have "unlimited" proliferative potential, and be clonogenic in culture. Polyclonal tumours have stem cells with multiple proliferative characteristics.
Monoclonal tumour cells may undergo a series of transforming stages or stimuli before developing into a fully fledged tumour (Woodruff 1988). This has been demonstrated in a variety of human tumours by clonal analysis of cells in tissue culture. Woodruff observed that not all tumour cells retain unlimited proliferative potential, and that some may stop cycling temporarily or permanently. Normal stromal cells, such as fibroblasts and inflammatory cells may also modify the cell cycle behaviour and the antigenicity of the tumour cells. Polyclonal tumours may occur in multiple sites simultaneously or in response to chronic and disseminated stimuli such as chemical carcinogens or radiation (such as basal cell carcinomata). The flow cytometer may be used to distinguish clones in human tumours, if suitable markers are found.
1:1:8. Cell cycle kinetics and cancer metastasis.
It is often the behaviour of the metastases rather than of the primary tumour which kills the patient. Do metastasising cells have features which distinguish them from primary tumour cells? Are they selected subpopulations of malignant cells? If so, can any of these differences be identified through changes in their cell cycle parameters, or by changes in the secretion of proteins? (Nicholson 1979). Poste (1982) provided evidence that primary tumour cell populations are heterogeneous with regard to their potential for metastasis. He assessed the metastatic potential of subclones of tumours such as the B16 melanoma cell line. Some cell clones showed no metastatic potential. This suggested that metastasis may be a non-random process.
Clonal heterogeneity implied that appropriate treatment for one subpopulation of tumour cells may be inappropriate for another subpopulation.
1:1:9. Methods of measuring cell kinetics.
A simple method of study of cell cycle parameters is the direct counting of features in histological sections. The Mitotic Index is the proportion of cells in mitosis compared to the total population. These cells are recognised by their condensed chromatin. The mitotic index does not give an indication of the growth fraction or of the Tc, but is a crude assessment of the degree of proliferation. Colchicine, Vincristine and Vinblastine arrest dividing cells in metaphase. Stathmokinetics is the study of the rate of accumulation of arrested cells in serial measurements from in vivo or in vitro specimens. The method allows the rate of entry of cells into mitosis, the rate of cell birth, the potential doubling time and the duration of mitosis to be calculated. It is affected by the efficacy of the drug employed, and by sampling problems due to tumour heterogeneity.
1:1:10. Thymidine labelling.
The mainstay of the study of cell kinetics has been Tritiated Thymidine (3H-Thy) uptake. 3H-Thy is incorporated into synthesising cells in the S phase (Taylor 1957). Ethical considerations limit its clinical use. It has been important in the study of in vitro systems and in vivo animal models. The technique of autoradiography and film processing used, and the method of background subtraction chosen affect the results. Radiolabelled cells need to be counted manually. Large numbers of cells should be counted to compensate for local irregularities in uptake and to improve statistical accuracy. The autoradiographic plates take 10 days or more to develop. 3H-Thy experiments fall into two categories.
In Pulse and Double labelling experiments, the tissue under study is exposed to short pulses of single or multiple radioisotopes, which are taken up by S phase cells. This allows calculation of the labelling index and the duration of the S phase (Ts) if the cells are fixed soon after uptake of the isotope. In Grain count halving and Fraction of Labelled Mitoses (FLM) experiments, cells are allowed to proceed through the cell cycle after uptake of the isotope.
Grain count halving.
As labelled DNA divides at mitosis, so the grain count halves. The time elapsed from pulse labelling to the first mean halving is a measure of time(Ts + TG2 + TM).
Fraction of Labelled Mitoses, FLM.
Cells are pulse labelled in vitro or in vivo. Serial sampling allows calculation of the cell cycle and phase times from the peak numbers of cells in mitosis as the first and second cell cycles are reached. The method assumes asynchrony, and is confounded in a synchronous population of cells. Precise definition of the first peak is rarely possible outside closely controlled cell culture systems, and the second peak is often lost or blurred.
Human tumour kinetic data has been obtained from radio-labelling experiments. Young and DeVita (1970) calculated the Ts of three melanomas and three breast tumours by topical injection of 3H-Thy into subcutaneous tumours. Serial biopsies were performed, and the percentage of labelled mitoses were plotted against time after injection to derive a Tc of 19-24 hours. Frindel et al (1968) studied five patients with large cutaneous tumours by intravenous injection of 3H-Thy. Seven to 17 serial biopsies were taken from each patient to calculate a Ts of 7-19 hours and a Tc of 1-4 days. Bresciani et al (1974) studied five squamous head and neck tumours with an intracarotid injection of 3H-Thy to obtain a Ts of 18-34 hours. Chavaudra et al (1979) compared in vitro and in vivo 3H-Thy labelling indices of 16
squamous carcinomas and found a poor correlation between results in one third of their cases. The mean duration of Tc was 48 hours of 53 human tumours reviewed by Tubiana and Courdi (1989). The S phase duration was 18 hours and the Tc/Ts ratio was 0.4. A fuller review of clinical results using 3H-Thy was presented by Meyer in 1982.
1:1:11. Measurement of DNA content by Image cytometry.
The DNA content of nuclei can be measured in cell smears and tissue sections stained by the Feulgen method or by Ultra Violet spectrometry (Caspersson 1960). A correction is made for the total nuclear DNA content. The method is time consuming but allows selective and retrospective study of nuclei of interest.
1:2:1. The measurement of cell kinetics using BRdU.
BRdU is a synthetic Deoxyuridine analogue. It is one of a family of DNA base precursor analogues which include 5-Fluoro-uracil (5FU) and 5-iodo-deoxyuridine (5IUdR) and which were intended for use as chemotherapeutic drugs. It was developed as a tumour radiosensitiser, to be given as an adjunct to radiotherapy by intravenous injection in doses of one gram per day for up to 40 days. Cellular DNA containing BRdU is more sensitive to ionising radiation. The practical use of BRdU in this role, for example as a radiosensitiser for human brain tumours has still to be established (Kinsella et al 1984). However, it is useful in the study of cell proliferation and cell kinetics because of its particular properties. It inhibits cell differentiation in a variety of cell types, and has been used to study the molecular biology of differentiation (Wright 1986). It is incorporated into cells during DNA synthesis in the S phase in competition with thymidine (Figure 1:3). It quenches the fluorescence of the non-intercalating DNA-specific blue dyes Hoechst 33342 and 33258 (Crissman 1987). Early flow cytometric studies on cell kinetics used the quenching effect of BRdU on the fluorescent dye Hoeschst 33258. Latt (1977) reported the incorporation of BRdU into tumour cells in vitro by continuous labelling. The doses of BRdU required for these studies were too large for clinical use.
BRdU has been used in clinical practice, both at a total dose of 40 grams over 40 days (1gm/day) for patients with brain tumours, and at the smaller dose of 250mg as a single intravenous bolus for cell labelling studies. When this dose is given 2-20 hours before surgery, BRdU is incorporated in measurable quantities into human tumours and tissues (Begg 1985, Wilson 1988). It can be detected immunochemically both in cell suspensions by flow cytometry and in appropriately prepared formalin fixed histological sections.
In addition to its clinical applications, BRdU can be used as a DNA marker in a range of experiments. For example, Papa et al (1988) were able to monitor the physical separation of heterogenous populations of cycling and resting erythro-leukemia cells labelled with BRdU on a discontinuous Percoll Density Gradient fractionation system.
1:2:2 Clinical side effects of BRdU.
Proof of the safety of BRdU is essential for the acceptable use of BRdU in clinical research. Work has been performed on the effects of 5-halogenated pyrimidine incorporation into native DNA of experimental cell systems (Raffel et al, 1988). Ultraviolet light increases the damage to DNA containing BRdU in rat brain tumour cells in culture. Barrett (1978) reported neoplastic change in 50% of cultures of Syrian Hamster Embryo cells grown in a medium containing BRdU and exposed directly to near ultraviolet irradiation. This experiment was designed to demonstrate that a direct perturbation of DNA is sufficient to initiate neoplastic change. This observation has no recognised clinical parallel, but the possibilities of photosensitisation and mutagenicity attributable to BRdU must be considered in clinical practice although no evidence of this has been reported. Kaufman (1986) reviewed later work on the mutagenesis of BRdU in experimental cell systems. Serious or specific side effects with low dose BRdU have not been detected in clinical practice. Fine and Breathnach (1986) reported two cases of cutaneous papular eruptions in patients with brain tumours treated with high dose BRdU and radiotherapy.
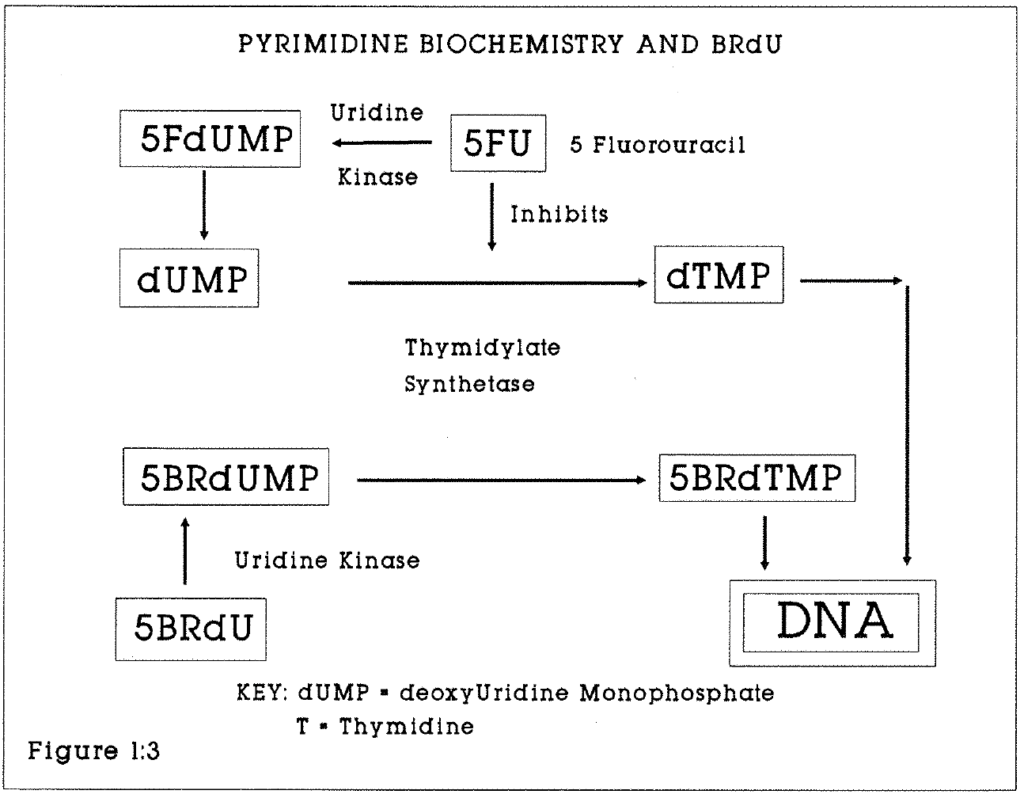
Figure 1:3. This flow chart shows the principle biochemical relationships of BRdU, 5-Fluorouracil and Thymidine synthesis via deoxyuridine monophosphate.
1:2:3. Cellular handling of thymidine and its analogues.
The calculations upon which cell cycle kinetic measurements are based assume that the 3H-Thy or BRdU bolus is handled as a true pulse label following injection. This assumption may break down at the organ or cellular level. For example, circulating BRdU may be sequestered for gradual release in body tissues, thus being presented to S phase cells continuously rather than as a bolus. Impaired tissue perfusion will deprive some S phase cells of the label. At the cellular level, BRdU delivery requires trans-membrane and intracellular transport to the nucleus, where it will be in competition with endogenous thymidine for incorporation into DNA. Pulse labelling may therefore fail to identify all S phase cells. Hamilton and Dobbin (1985) examined the effect of the endogenous nucleotide pool on thymidine labelling. Fluoro-deoxyuridine (FdUrd) binds to the enzyme thymidylate kinase and blocks de novo synthesis of thymidine monophosphate from deoxyuridine monophosphate (UdR). FdUrd thus effectively blocks the endogenous pool of UdR and enhances the incorporation into DNA of exogenous (eg Tritiated thymidine) label. They found that the mean thymidine labelling index of the undifferentiated mouse carcinoma NT was increased from 27% to 46% by pretreatment with FdUrd. Labelling with repeated doses of tritiated UdR produced a lower S phase labelling than did pretreatment with FUdR. It was concluded that this was evidence for the existence of large endogenous nucleotide pools, which could not be saturated with a single injection of 3H-UdR.
1:2:4. Monoclonal Antibodies
Monoclonal antibodies are derived from a single cell line and have a high degree of specificity against molecular epitopes and antigens. The secretion of monoclonal antibodies by tumours such as the myeloma has long been recognised. Their potential in research and therapeutics was realised when Kohler and Milstein (1975) produced immortal hybridomas which secrete monoclonal antibody of known specificity. Hybridomas are formed by fusing myeloma cells with lymphocytes from an animal which has been treated with the antigen to be studied. Those cells which produce the antibody can be selected and cloned in growth media or in vivo.
1:2:5. Monoclonal antibodies against BRdU
In 1982, Gratzner described the manufacture of monoclonal antibody B44 (Becton Dickinson Laboratories), which is specific for BRdU incorporated into denatured DNA (Gratzner 1982, Dolbeare 1983). Since then other antibodies have been raised against this compound by a variety of routes, each antibody having different affinity and specificity for BRdU. Vanderlaan (1985) at Lawrence Livermore laboratories described the IU-1 and IU-2 antibodies which label BRdU in denatured DNA. Gonchoroff (1985) described the BU-1 antibody which recognises BRdU in DNA which has not been denatured. BU-1 allows S-phase measurements to be made in intact cells. These antibodies rarely bind to BRdU in the free state. Miller et al (1986) suggested that the nucleoside sugar moiety and the DNA molecule are both important recognition epitopes.
1:2:6. Iododeoxyuridine
Iododeoxyuridine (IUdR) has similar properties to BRdU and has been used as an alternative for in vivo kinetic studies. It is cross reactive to the IU-4 but not the BR-3 monoclonal antibody. This difference may be of practical value for sequential in vivo kinetic studies. Shubui et al (1989) have demonstrated the ability to distinguish the Bromide and Iodide epitopes in double labelled human glioma cell lines grown in culture. Begg et al (1989) have used IUdR as an alternative to BRdU in the measurement of the Ts and Tpot of human tumours. They reported that the mean coefficients of variation of the Ts, LI and Tpot of six transitional cell carcinomas of the bladder and seven head and neck squamous tumours were 10%, 24% and 27% respectively. They concluded that the IUdR/FCM method can be successfully used in human tumours and has sufficient accuracy for predictive classifications of tumours based on proliferation data.
1:2:7. Flow cytometry
The history of the development of Fluorescence Activated Cell Sorting (FACS) has been described by Shapiro (1987) by Herzenberg et al (1976), and by Andreeff (1986). Mayall (1988) observed that successful flow and image cytometry combines four principal technologies, namely of sample preparation, the use of appropriate probes and markers, instrumentation, and data display and analysis.
The complexities of these techniques require caution in the interpretation of results, in the identification of artefacts and in the comparison of results between one laboratory and another.
A. Sample preparation; General principles
Flow cytometry has advantages in cell research in the analysis of heterogenous rather than homogenous populations of cells, such as malignant cells with variable amounts of DNA per cell. Flow cytometry requires a monodisperse suspension of cells or cell nuclei. Blood cells are naturally suitable to this. Samples of solid tumours require disaggregation by mechanical or chemical techniques which can result in extensive sample damage. The demonstration that single cell and nuclear suspensions could be obtained and analysed from paraffin-embedded blocks of tissue was a major advance (Hedley et al, 1983).
B. Instrumentation
A range of flow cytometers with different technical specifications are in scientific use (Shapiro 1988). Two machines were used in the course of this study.
- The Orthocytofluorograph linked to a DIGITAL (Digital Corporation) 2150 computer.
- The purpose-built Cambridge MRC Flow Cytometer, linked to a Vax computer.
Although technical specifications vary considerably, the general principle of operation to make multiparameter measurements is similar, and is shown in Figure 1:4. Suspensions of fluorescently labelled isolated cells or cell nuclei are streamed coaxially through a chamber with a laser light source of known wavelength. The resulting light emissions can be collected, filtered to select specific wavelengths, amplified through photomultiplier tubes (PMT), digitised and stored on a computer disk for subsequent analysis. Light striking the particles is also scattered. Photomultiplier tubes can be positioned at various angles, for example forwards and at 90 degrees to the exciting source, to collect light at the exciting wavelength. This gives a measurement of particle size. Cells with a particular fluorescence can also be separated and sorted into separate collecting vessels. In this application, signals from light detectors are used to induce electrical charges on the fluid droplets containing the cells of interest. The droplets can then be manipulated in an electrical field into collecting vessels.
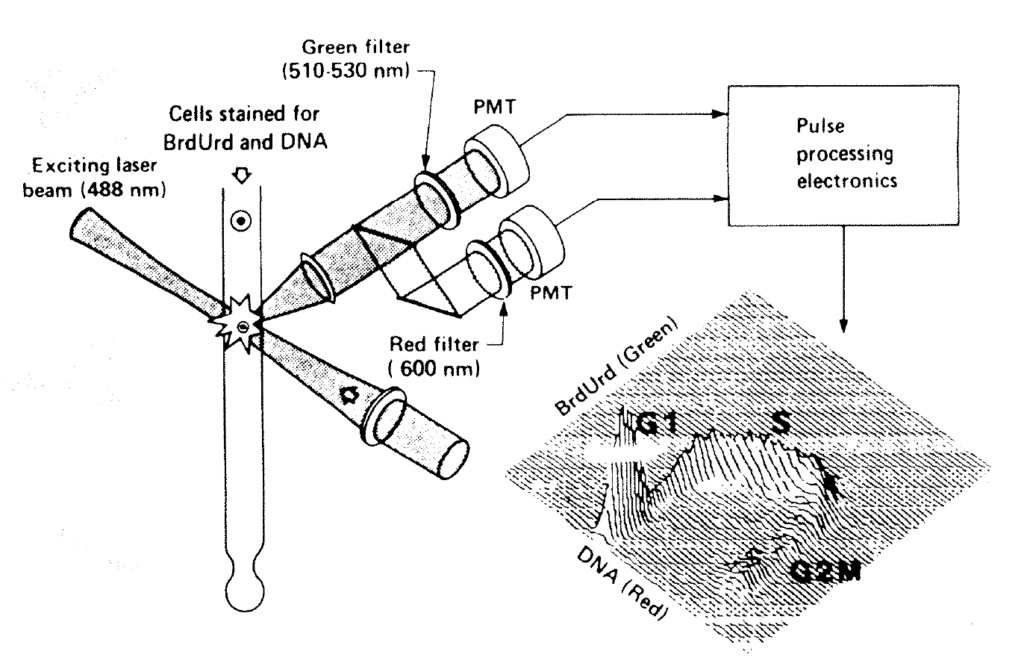
Figure 1:4. This diagram shows the principle of multi-parameter flow cytometry by which both the DNA profile and a nuclear antigen such as bromodeoxyuridine or p62c-myc are analysed. Coaxially streamed nuclei are excited by blue light of 488nm. The resulting fluorescence is collected in two or more photomultiplier tubes (PMT1 and PMT2).
C. The use of appropriate probes and markers.
It is not usually possible to measure a feature of interest, such as a membrane antigen or nuclear DNA content directly. Indirect probes include fluorescent dyes and fluorescent labelled monoclonal antibodies. The probe must react stoichiometrically (in direct proportion) and be excitable and detectable within the technical parameters of the flow cytometer used. Hoffman (1988) reviewed the physical characteristics of commonly used fluorochromes and their application to FCM. Examples of suitable fluorochromes are given in Figure 1:5.
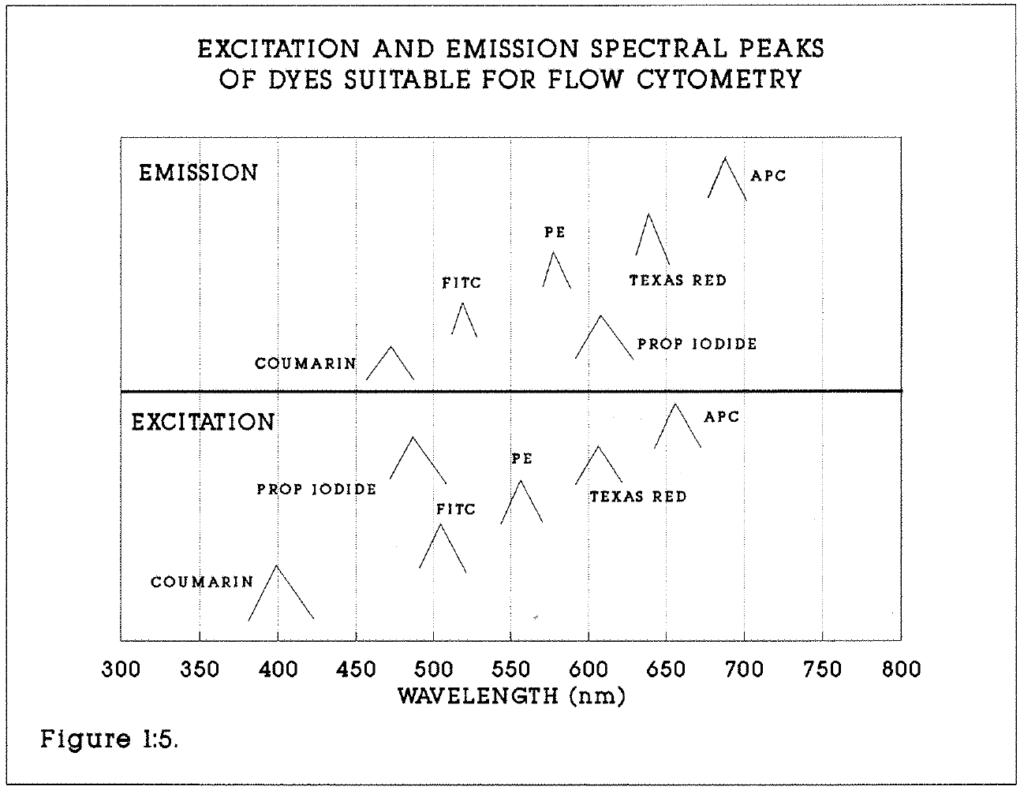
Figure 1:5. This diagram emphasises the differences between the excitation and emission spectral peaks of a range of fluorochromes, particularly Fluorescein (FITC) and Propidium Iodide (PI). Others shown include Phyco-Erythrin (PE) and Algal Phyco-Cyanin (APC).
D. Data display and analysis.
The facility to collect and analyse light of multiple wavelengths and characteristics simultaneously gives rise to many applications. These include quantitative cytology, such as the identification and separation of lymphocyte subsets in immunological studies, using fluorescent labelled anti-T and anti-B antibodies. The measurement of time-dependent (eg enzymatic) processes linked to fluorochromes has been described (Watson 1987). A plot of nuclear numbers against fluorescence intensity of dyes which bind stoichiometrically to DNA (Watson 1987) yields a histogram from which the DNA content of cells can be calculated. Such dyes include Mithramycin, which binds to G-C base pairs and fluoresces yellow-green, and propidium iodide, which fluoresces red.
When one fluorochrome is measured, the technique of data analysis is known as Univariate DNA Distribution analysis. It can also be applied to asynchronous and perturbed (eg drug treated) cell populations. The data derived from such analysis is insufficient to allow deductions about cell cycle periodicities (Gray et al 1986), but will yield a measure of the DNA profile and the S phase fraction of a population of cells. Modern FACS machines allow simultaneous measurement of two or more wavelengths of emitted fluorescent light. The use of three or more simultaneous fluorescent probes is possible. Dent et al (1989) have described the simultaneous paired analysis by flow cytometry of cell surface markers (such as the human transferrin receptor), cytoplasmic antigens (such as the myeloperoxidase enzyme), oncogene expression (using the c-myc oncoprotein) and DNA content in human leukocytes.
1:2:8. Limitations of flow cytometry.
Flow cytometer output must be controlled and interpreted by trained observers. Data collection and histogram presentation is markedly affected by photomultiplier settings, which need to be reset from specimen to specimen. The machine/operator interaction may introduce subjective error. Interpretation of histograms may also introduce error. For example, small aneuploid peaks may not be identified or merge into the G1 peak. Infrequent cell events or rare subgroups may be overlooked. Artefact is a particular problem in the analysis of formalin fixed archival material. DNA may be registered as aneuploid rather than diploid owing to the presence of artefactual peaks (Fordham et al 1986).
1:2:9. Multiparameter DNA analysis and the cell cycle.
The measurement of cell cycle parameters by analysis of two fluorochromes (Propidium iodide for DNA and fluorescein for BRdU) and light scatter is the basis of the BRdU/FCM method. Success is determined by a number of factors.
- Fixation. Optimum conditions for specimen preservation are necessary.
- Disaggregation. Nuclear suspensions are more difficult to prepare from tissues with high collagen and fat content. Nuclear extraction is achieved by using pepsin. Schutte et al (1987) reported the digestion of ethanol fixed cell fragments with pepsin. The conditions will be described in detail in the methods section. Cytoplasmic and cell membrane antigens are not preserved.
- Denaturation. In order to measure the incorporation of BRdU into DNA by monoclonal antibody, the antigenic epitope in single stranded DNA must be exposed to the antibody. Double stranded DNA, to which propidium iodide (PI) binds, is then partially denatured (“unravelled”) to expose the BRdU to the antibody. DNA containing BRdU is partially denatured by acid or heat treatment. Dolbeare (1985) reported that optimum partial denaturing of DNA occurs by extraction with 0.1M HCl, followed by heating to 80°C in 50% formamide solution. Wilson (1988) considered that heat treatment produces unacceptable clumping of nuclei. Beisker et al (1987) reported a 5-stage procedure whereby chromatin proteins are first extracted with HCl and 0.7% triton. Cellular DNA is denatured at 100°C in distilled water. Houck and Loken (1985) described a disaggregation technique which also preserves cell membrane antigens, thus allowing flow cytometric analysis of three simultaneous factors, including nuclear and surface antigens. They tested this method on thymocytes and leukocytes; cells were labelled for surface antigens, fixed in cold 0.5% paraformaldehyde, then suspended in 2M HCl and the detergent Tween 20 before staining. The Anti-BrdU antibody is detected by a second monoclonal antibody (rat anti-mouse FITC) coupled with the dye fluorescein (FITC). Dolbeare (1983, 1985) demonstrated that this technique can be used to provide a quantitative measurement of BrdU incorporation into cells because antibody binding is stoichiometric.
Propidium iodide and BrdU Labelled nuclei are excited by light of 488nm in the flow cytometer. The resulting red fluorescence is collected above 620nm and green fluorescence between 510 and 560nm. Ethidium bromide, an alternative to PI, fluoresces red at 575nm under 488nm light excitation. Data are collected in list mode, and the nuclear doublets and multiples excluded from further analysis by gating on the DNA peak versus area signal (see Figures 1:6a and b). This technique has high sensitivity to low levels of BrdU. Bivariate DNA distribution analysis is used to obtain cell cycle kinetic data.
Figures 1:6a, 1:6b (overleaf). These diagrams illustrate the gating used to calculate the numbers of events and the mean values of events within fields of interest. They should be read in conjunction with examples of the histograms shown in subsequent chapters. Green fluorescent events (BrdU labelled nuclei) are indicated on the Y axis. The gating boxes must be reset for each specimen. Within each box the total number of events and the mean DNA content are calculated automatically. For example, the total labelling index of an aneuploid tumour will be the ratio of the contents of box 2 to box 1. The Relative Movement (RM) of this tumour would be calculated from the mean DNA content of boxes 7, 8 and 9. In general, events above Channel 20 were taken to be indicative of BrdU labelling. In exceptionally well defined histograms this limit was as low as Channel 5.
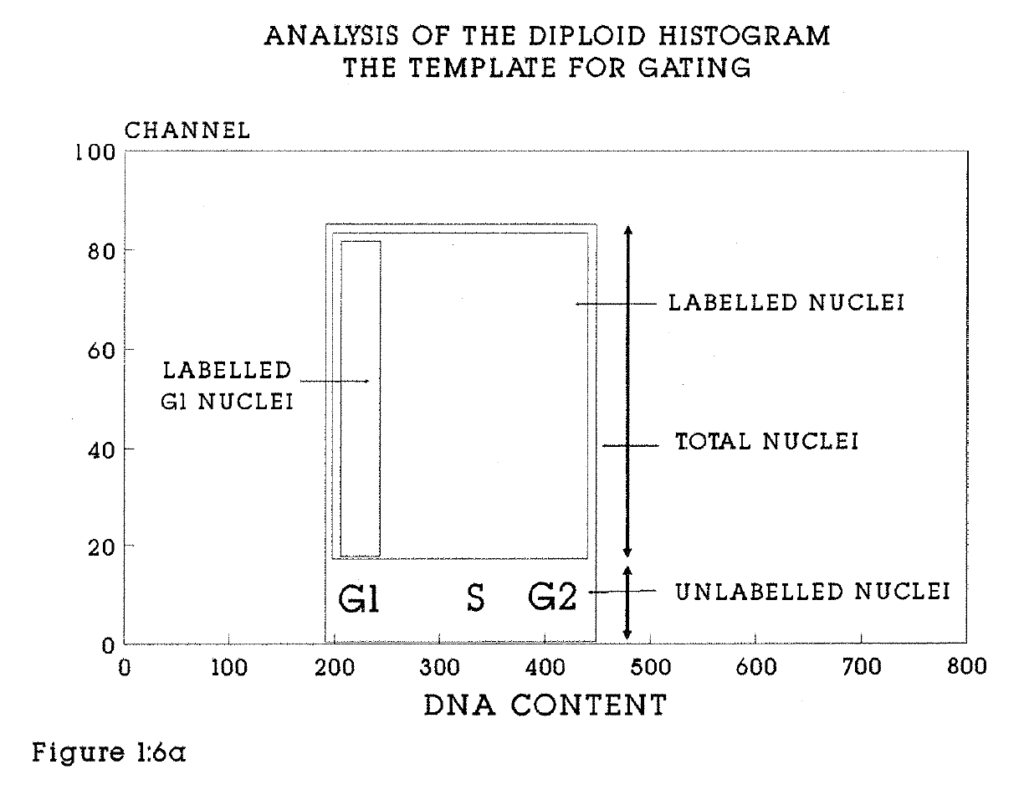
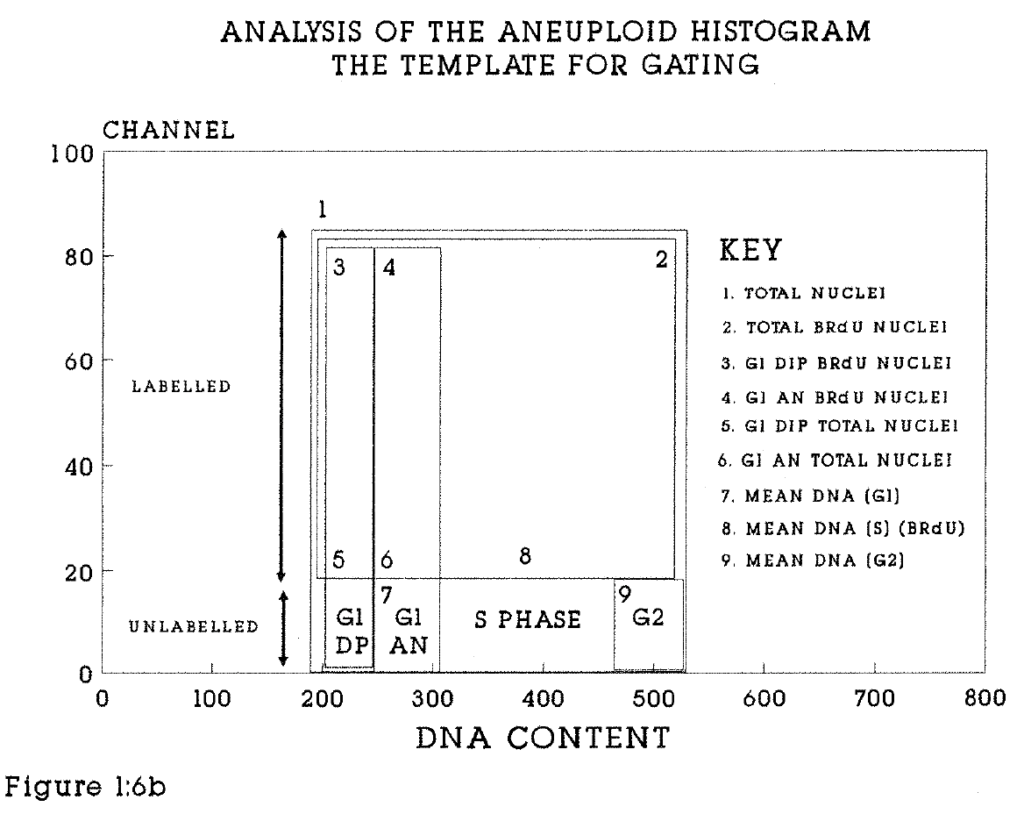
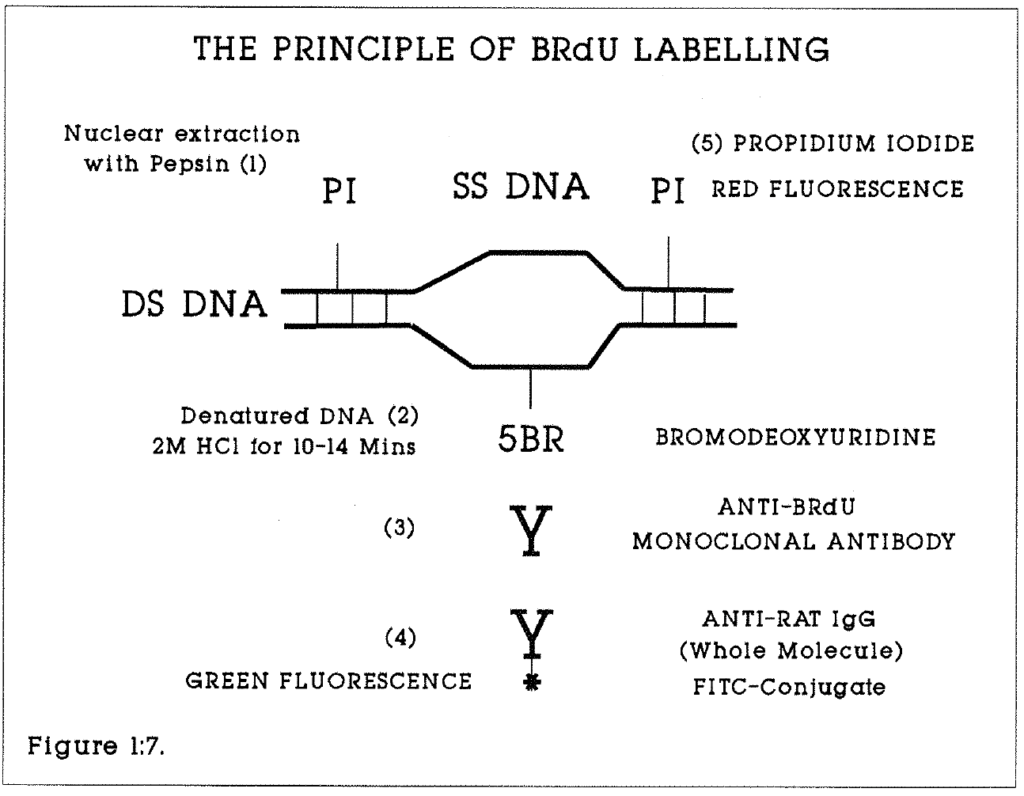
Figure 1:7. This illustrates the staining technique for BRdU labelled nuclei for flow cytometry. A similar method of labelling is used for histological sections but using the avidin biotin complex in place of Fluorescein.
1:2:10. The mathematics of cell cycle analysis.
The simplest model of the cell cycle assumes that:
- All cells in the labelled population are proliferating.
- The distribution of cell ages is rectangular.
- The cell population is in a steady state.
- No account is taken of stem cell subpopulation behaviour.
- All cells in the tissue have the same derivation or behaviour.
- There is no cell loss. If all S phase cells take up the BRdU label, the labelling index is the ratio of the duration of the S phase (Ts) to the cell cycle time (Tc).
Then, Tc = Ts / LI.
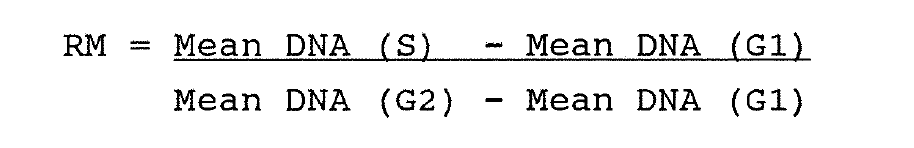
Begg et al (1985) described a method to measure the duration of DNA synthesis and the potential doubling time (Tpot) of mouse tumours from single samples labelled in vivo with BRdU. They used the formula [Tpot = L . Ts / LI] where L(lambda) is a correction factor for non-linear distribution of cells through the cycle, and varies between ln2 (0.7) and 2ln2 (1.4) (See Steel 1977). The movement of labelled (green fluorescing) cells through the S phase with time is related to the mean DNA content of the G1 and G2 cells. The mean DNA content of the labelled cells changed linearly with time until all have moved into the next cell cycle. It is possible to calculate Ts from a single biopsy at a variable time after pulse labelling with BRdU if three assumptions were made about the cell cycle. Firstly, at the time of labelling, S phase cells are evenly distributed with a mean DNA content in mid-S phase. At T0 the relative movement (RM) of S phase cells between G1 and G2 is 50%.
Secondly, labelled cells from the start of the S phase must reach G2, in a time Ts. At this time, RM = 1.0. This concept is illustrated in Figure 1:8. The time from injection of BRdU to biopsy, T(inj), is known for each specimen studied. If the RM is a linear function of time, Then,
Thirdly, DNA synthesis is assumed to proceed uniformly during the S phase. In an expanding population of cells, there will be a non-linear distribution of cells through the cycle, with more cells at the beginning than at the end of the S phase on the DNA histogram. This will weight the initial value of RM towards G1.
The mean values of the DNA content in each phase are calculated by gating on histogram (Figures 1:6a and 1:6b).

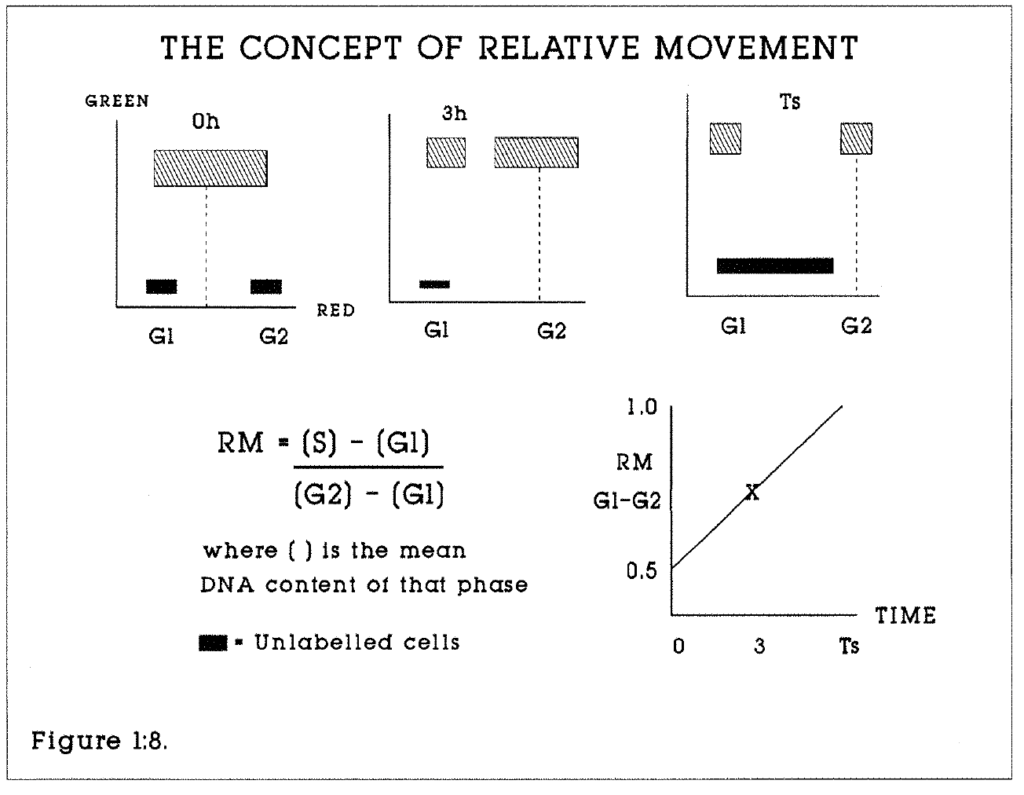
Figure 1:8. This illustrates the concept of Relative Movement. At 0 hours, the time of injection, BRdU labelled cells are evenly distributed through the S phase. After the period Ts has elapsed, all labelled cells will have passed into G2/M and G1 of the next cell cycle. If the time of biopsy is less than Ts, for example 3 hours in this model, the Ts can be calculated if linear progression is assumed.
The BRdU labelling index is calculated as follows. The population of BRdU labelled nuclei is derived from labelled cells in S, G2 and M which have not yet divided and labelled cells which have divided and the daughter cells have reentered G1. A simple correction is made to adjust for this factor.
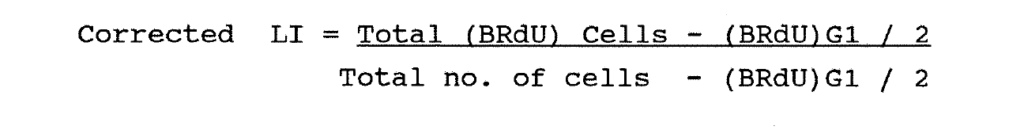
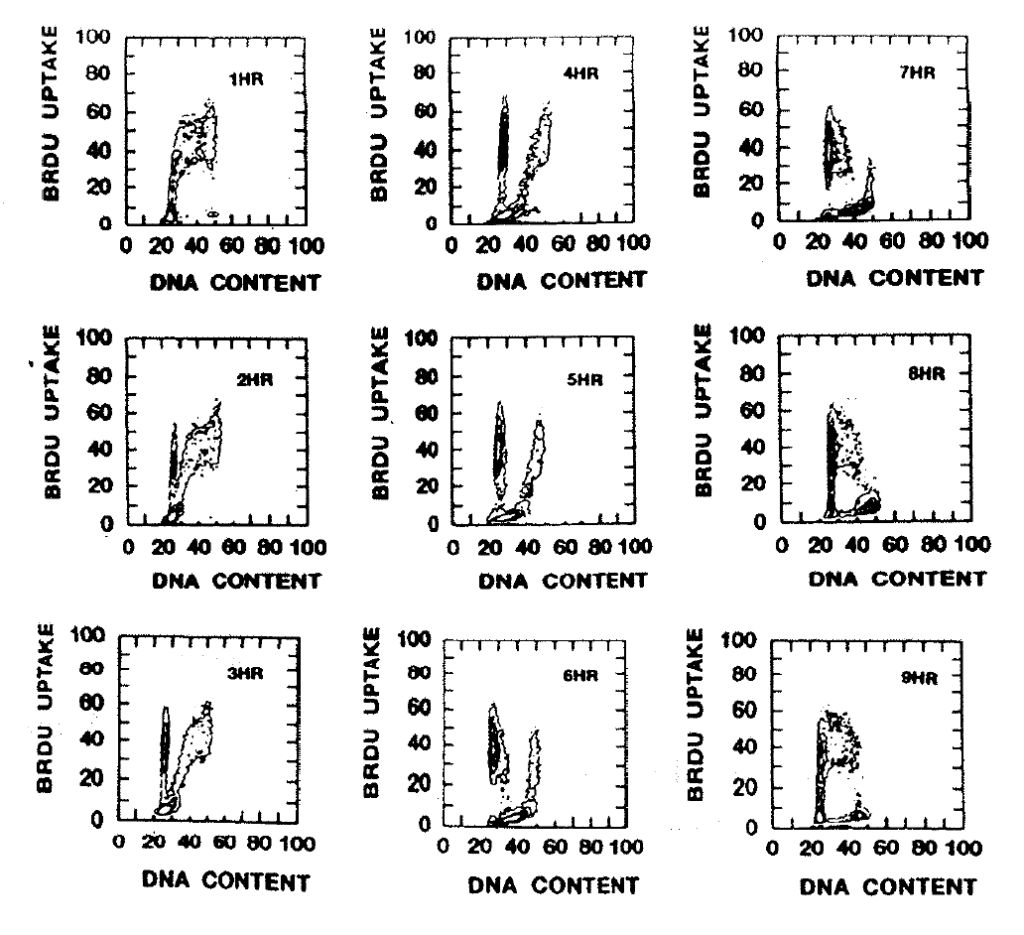 Figure 1:9. This figure provided by Drs. G. Wilson and N. McNally illustrates the change of BRdU content with time in relation to the phases of the cell cycle. The SAF sarcoma was grown on the backs of CBA mice. When the tumours had reached 8–10mm in diameter, the mice were injected intraperitoneally with 0.1mg/gm BRdU. Animals were sacrificed at one hour intervals (marked on the histograms) for the next nine hours. The tumours were analysed by flow cytometry as described. One hour after the injection all BRdU labelled cells were in the S or G2 phases. With time progressively more cells pass through G2/M and reappear in the G1 phase of the daughter cell cycles, until by nine hours the majority of these cells have moved into the S phase of the next cell cycle.
It is not possible to calculate the number of unlabelled G2 cells at the time of injection which have since divided, thus leading to a probable underestimate of the true Labelling Index. It is assumed that all proliferating cells express the label. This may not be correct (Hamilton and Dobbin 1985), in which case the true growth fraction will be underestimated. The proportion of labelled to unlabelled S phase cells can readily be calculated by gating on the labelled and total S phase regions. However, because of the time lag between labelling and biopsy, some of these cells will have been in G1 at T0 to explain their lack of label (Wilson 1985, 1988).
Computers allow theoretical models of the cell cycle of varying complexity to be tested against experimental data (Dolbeare et al, 1985, Steel 1986). Yanagisawa et al (1985) described a "continuous maturity compartment model", tested against the growth of CHO cells in vitro, and obtained good matches between theoretical and observed measurements of the durations of G1, S and G2M. Mann (1987) addressed the mathematical and statistical problems associated with multi-dimensional data analysis of multiple parameters measured simultaneously by flow cytometry, and with data reduction from large samples.
1:2:11. Immunohistochemical staining for BrdU.
BrdU can be detected in labelled tissues by fluorescence microscopy (Watson 1987) and standard immunohistochemistry using the same primary antibody as used in flow cytometry. This is an important adjunct to flow cytometry, because it allows the distribution of S phase cells in tissues to be seen. These patterns cannot be described by flow cytometry. Moreover, quantitative planar image cytometry can be performed (Chapter 5) and the labelling index, though not time dependent parameters, can be estimated. This meets Mayall’s criterion (1988) that information obtained by one mode of cytometry should be correlated with other sources where possible.
Wynford-Thomas (1986) and Hayashi et al (1988) described histochemical techniques for conventional microscopy by which pretreatment of formalin fixed, paraffin-embedded tissues with protease, trypsin or pepsin facilitates staining with anti-BrdU antibody. Many BrdU labelling studies have been performed on histological sections. For example, Kikuyama et al (1987) calculated the BrdU Labelling Index of human tumour xenografts serially transplanted into nude mice. Van Dierendonck et al (1989) studied the intranuclear staining patterns of BrdU and recognised three stages of organisation of DNA synthesis during the S phase of rodent and human tumour cells in culture.
Histochemical studies of in vivo labelling of human tumours with BrdU have been performed. For example, Kikuyama et al (1988) calculated the LI of gastric carcinomas using an infusion of one gram of BrdU in 100ml saline over 30 minutes, given one hour pre-operatively. They calculated the LI by counting labelled cells under the microscope.
1:2:12. A Comparison of BrdU/FCM and radioisotope studies.
Tritiated thymidine and BrdU are handled in similar fashion by living cells. Comparisons can therefore be made between cell kinetic data obtained using these labels. The measurement of the labelling index on autoradiographic slides can be compared with the BrdU labelling index from immuno-histochemically stained slides. The comparability between the labelling index of tissues which have been incubated in vitro with BrdU or 3H-Thy has been established in a number of studies. For example, Gunduz (1985), compared the labelling index of human breast tumours and obtained similar results by both techniques. Autoradiographic measurements can be compared with flow cytometric results. Wilson (1985) found similar results when human colorectal and cervical tumours were incubated in vitro with 3H-Thy or BrdU. Autoradiography and BrdU/FCM methods yielded similar values of the labelling index in 21 randomly selected tumours.
There also appears to be high concordance when the Ts, Tc and Tpot are calculated by the Fraction of Labelled Mitoses and BrdU/FCM techniques. For example, Trent et al (1986) compared methods for analysis of total cell transit time using rat embryo fibroblasts. Dolbeare et al (1985) collected cells labelled with tritiated BrdU using the cell sorter, and demonstrated a close correlation between BrdU fluorescence and radioactive labelling of nuclei in the S phase.
The type and quality of information derived from tritiated thymidine and BrdU labelling are similar when direct comparisons are made using experimental models and in vitro labelling of human tissues. The advantages that BrdU/FCM has over FLM are in the practical applications of the method. Firstly, the need to use radioisotopes in FLM renders in vivo studies in humans unacceptable on ethical grounds except in very rare circumstances. The safety of a single 250mg injection of BrdU allows in vivo cell kinetic studies of human tissues and tumours to be performed where informed consent has been given by the patient. In vivo labelling provides the optimum means to study normal biological processes. Moreover, it avoids the difficulties inherent in drawing conclusions about human tumour and tissue biology from animal and cell system models. It is thus the most credible of the methods of investigating human tumour kinetics.
Secondly, FLM requires multiple sequential biopsies to be taken from a tumour or tissue in order to plot a graph. BrdU/FCM information is obtained at a single biopsy. Thirdly, speed of analysis of the BrdU/FCM method allows results to be obtained within 24 hours, making clinical studies practical. Autoradiographic film requires several weeks for development. Fourthly, automation of analysis by flow cytometry allows counting of multiple parameters on a large number of cells at high speed. FLM requires manual counting of cells which is much slower, measures fewer parameters and is susceptible to larger sampling and counting errors.
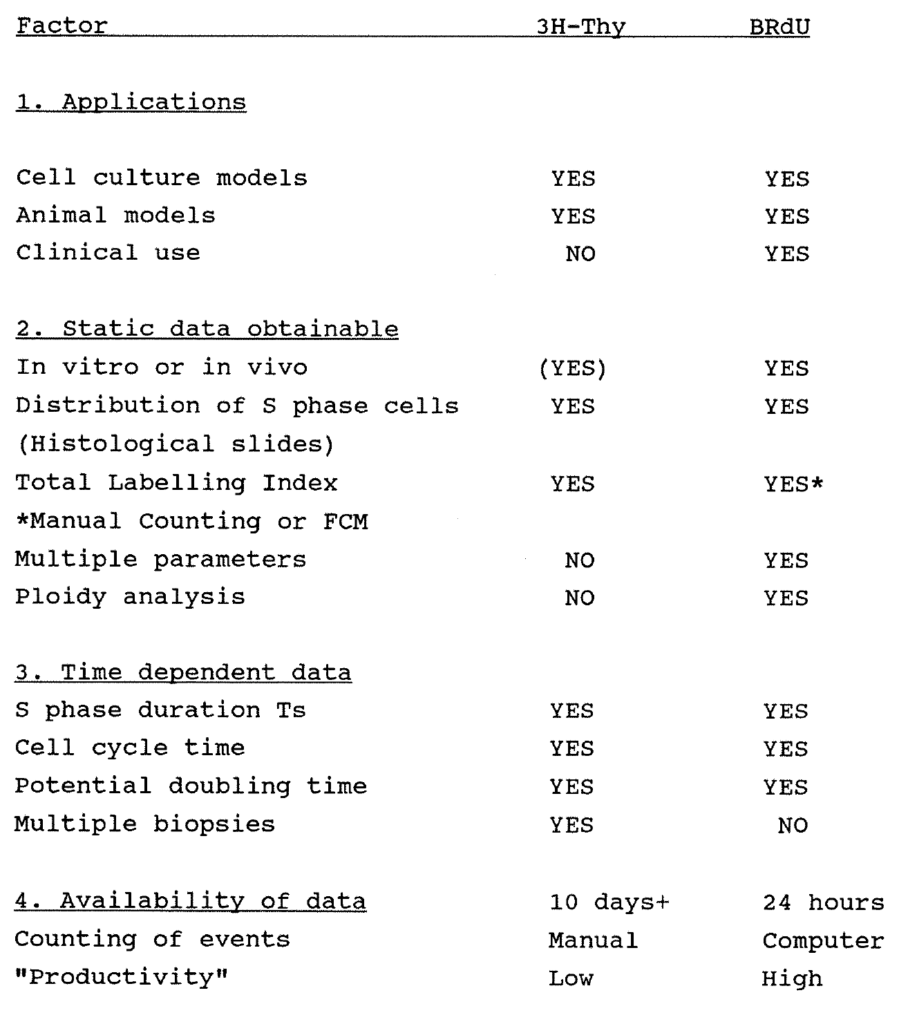
Table 1:1. Comparison of the advantages and disadvantages of BRdU and 3H-Thy Labelling.
Alternative methods of measuring dynamic cell kinetics by flow cytometry without BRdU or IUdR have been reported. For example, Darzynkiewicz et al (1986) observed that there is a close relationship between RNA and cell protein content and the cell cycle. By selective staining with the dye Acridine Orange, the DNA, RNA and cell protein content of CHO cells in exponential culture were analysed to give an indirect estimate of the cell kinetics. Other dyes such as FITC, Propidium iodide, Hoechst 33342 and rhodamine 640 can be used to obtain similar data. Pollack et al (1986) described a two-parameter cell cycle analysis by staining the DNA of rat prostatic adenocarcinoma cells with propidium iodide and the nuclear protein directly with FITC.
1:2:13. The limitations to kinetic analysis.
There are practical limitations to the scope of all methods of cell kinetic analysis. Firstly, isotope and BRdU/FCM methods take a snapshot of the growth kinetics of the tumour at the time of biopsy only. They do not indicate whether the growth rate changes with time. It may be possible to overcome this problem by studying a large number of tumours, excised at different sizes and stages of growth, or by measuring the Tpot serially on single tumours where the clinical situation permits. Such serial biopsies will require multiple doses of BRdU. The elimination rate of BRdU from tissues or tumours is not yet known. Residual BRdU may affect the calculation of the kinetics of subsequent biopsies. Data obtained from in vivo measurements of kinetics and tumour volume can also be fitted to theoretical models to test theories of tumour and tissue growth.
Secondly, FLM and BRdU/FCM provide measurements which do not take into account tumour and tissue cell loss during growth. There is a disparity between the actual volume growth of tumours as measured directly or by serial radiology and the potential doubling time. If the volume doubling time (Vd) of the tumour is known, the cell loss factor Theta can be calculated from the formula; Th = 1 - (Tpot / Td).
Thirdly, flow cytometry will not distinguish cells of interest in heterogenous populations of cells, unless those cells have a measurable distinguishing feature such as abnormal nuclear size. Tumour homogenates will include stromal, inflammatory and vascular cells with the tumour cells. This problem is less acute with aneuploid than with diploid tumours. In the former, all cells expressing aneuploidy can be assumed to be derived from the tumour cell line. Where the proportion of stromal tissue has been identified to be large by conventional histology, a correction should be made in the kinetic calculations. Fourthly, flow cytometry will not identify clonogenicity in tumour cell lines.
1:2:14. Clinical applications of flow cytometry.
The flow cytometer has been used extensively in clinical research in the study of DNA ploidy as a determinant of prognosis and in the measurement of the S phase fraction. Multiparameter analyses such as the BRdU technique have been less fully explored.
Ploidy is usually measured by labelling DNA with propidium iodide and univariate analysis performed on the resulting DNA histogram. Tumours are classified as diploid, or aneuploid if they possess quantitatively abnormal chromosome content. This excludes abnormalities of gene content or of chromosome structure such as balanced gains and losses in which total DNA content is unchanged. Cells containing an abnormal chromosome content may be identified as a subpopulation in the aneuploid histogram.
The DNA index, a ratio of abnormal to normal DNA content, and the S phase fraction of the population can be calculated from these histograms. Sensitivity is believed to be limited to gains or losses of more than one chromosome. There will thus tend to be an underestimation of tumour aneuploidy measured by flow cytometry. For greater accuracy, it is necessary to undertake histological chromosome analysis by methods such as
Feulgen staining. Ploidy studies do not give a measure of the duration of the cell cycle phases, but they do have the major advantage of being able to be performed on paraffin embedded specimens. The advantages, problems and technical aspects of ploidy analysis have been reviewed by Hedley (1983, 1989). Examples of diploid and aneuploid histograms are given in later chapters.
Abnormal DNA content is believed to be a conclusive marker of malignancy. Barlogie et al (1983) found that 75% of 3611 solid tumours had abnormal nuclear DNA content. Frankfurt (1984) reported that 430 of 656 human solid tumours contained aneuploid cell lines. A large number of studies have been reported where the DNA content of a series of tumours has been compared to other indicators of prognosis, such as the tumour grade, and to the subsequent clinical behaviour of the tumours (Hedley, 1989). These studies will be reviewed in greater detail in later chapters. The value of the ploidy data remains uncertain as a determinant of prognosis (Barlogie 1983, Tubiana and Courdi 1989).
1:2:15. BRdU/FCM Data from early clinical studies.
The validity of the BRdU/FCM technique was established in mammalian cell culture in vitro (see Miltenburger, 1987), and in animal models in vivo, such as xenografts of the KHT sarcoma in mice (Mitchell et al 1984, Pallavicini et al 1985). In vivo labelling of human tumours was reported in 1985 by Hoshino (brain), Raza (acute leukemia) and Wilson (seven assorted solid tumours). Wilson et al (1988) reported the in vivo measurement of the LI, Ts and Tpot of 26 evaluable assorted human tumours obtained by local biopsy. Riccardi et al (1989) reported the in vivo cell kinetics of 46 acute leukemias, 27 gastric carcinomas and 16 gliomas. Hoshino et al (1989) reported on the prognostic value of the BRdU labelling index of 182 intracranial gliomas (Chapter 8) The relationship of the in vivo kinetics of human breast, colorectal and gastric carcinomas to prognosis and to clinical outcome has not been studied in large series.
1:2:16. Conclusions
The purpose of this chapter has been to review the theory and applications of a new method of cell cycle analysis using bromodeoxyuridine labelling and flow cytometry. The method offers advantages over previous techniques for cell cycle analysis. It allows in vivo investigations to be performed on human solid tumours. In vivo BrdU administration has been used to obtain static labelling indices for tumours in a number of clinical studies, but little attention has been paid to the dynamic data which can be obtained. The use of BrdU to measure a static labelling index may have no advantages over in vitro techniques, whereas Ts and Tpot data may have practical value both as prognostic indicators and as guides to therapy. It is therefore important to evaluate the method in prospective series.
The work described in this thesis evaluates the BrdU/FCM technique in measuring the in vivo growth kinetics of human gastrointestinal and breast tumours and their metastases, and to relate data to clinical behaviour. Studies of the in vivo growth kinetics of human gastro-intestinal mucosa and polyps have also been performed on labelled resection specimens. Chapters 2, 3, 4 and 6 report on the studies into colorectal tumours, colorectal tissues, gastrooesophageal tissues and tumours, and breast tumours respectively. Each chapter has been set out in review, methods, results and discussion sections. Chapter 5 describes an original application of existing technology to facilitate the measurement of BrdU label in stained tissue sections. The kinetic data from a small series of solid tumours of various embryological origins will be reported in Chapter 7. The relationship of data obtained by BrdU labelling to the expression of a putative oncogene, the proliferation associated c-myc gene product p62c-myc, will be reported in Chapter 8. Clinical follow-up will continue so that full use can be made of the data described in subsequent chapters.
CHAPTER 2
The in vivo proliferation of colorectal carcinomas.
Chapter abstract.
The in vivo proliferation kinetics of 100 human colonic and rectal cancers are reported. 97 patients with colorectal adenocarcinomas were consented to receive a single bolus dose of 250mg BRdU between 2.4 and 16 hours prior to curative or palliative surgery. Tumour biopsies from the resection specimens were stored in 70% ethanol, disaggregated and analysed by multivariate flow cytometry. Cells labelled with BRdU were detected using a monoclonal antibody.
There were 48 diploid and 52 aneuploid tumours. The mean S phase duration was 14.1 hours. The mean total labelling index was 9.0%. The mean aneuploid labelling index was 12.0%. The mean potential doubling time was 5.9 days.
No correlation was found between measured kinetic parameters and the Dukes stage or histological appearance of the tumour. The correlations with prognosis will be established in due course.
2:1 Introduction. The importance of colorectal cancer.
In 1980 there were 23,250 colonic and 9,100 rectal cancers registered in England and Wales. 16,400 patients with colonic cancer and 6,100 patients with rectal cancer were recorded as dying of the disease. The recorded incidence of the disease and the number of deaths has gradually risen over 40 years, despite changes in diagnostic, surgical and adjuvant methods over that period.
Since Dukes (1932) showed the correlation between the extent of tumour spread and survival, much effort has been devoted to achieving early diagnosis of the disease. Patients with liver metastases have the worst prognosis. Surgery alone to the primary tumour and regional nodes guarantees cure in only 40% of cases. Current prognostic indices, in practice the Dukes staging and the histological grade of the tumour, are unable to discriminate patients at risk of recurrence from those with no residual tumour.
No adjuvant treatment such as chemotherapy and pre- or post-operative radiotherapy in conjunction with removal of the primary tumour has yet been demonstrated to produce a satisfactory improvement in survival. This may in part be due to insufficient activity and specificity of available treatments against colorectal cancer, and in part due to the inappropriate use of potentially beneficial treatments. A better understanding of the in vivo proliferation of tumour cells may identify cases suitable for adjuvant therapy, including immunotherapy (Durrant 1989) and better use of currently available treatments. The discovery of more specific and effective agents may stem from a better understanding of colorectal cancer proliferation and its molecular and genetic controls.
2:2. Proliferation in human colorectal adenocarcinomas.
The volume growth rate of tumours can be calculated in clinical practice by serial imaging. Camplejohn (1982) reported a wide range of values for the doubling time (Td) of human colonic tumours according to the methodology used. Using serial double contrast barium enemas, Welin (1963) calculated the mean Td of 20 primary tumours to be 620 days (range 138-1155 days). Bolin (1983) reviewed 27 patients with colorectal tumours who underwent repeated barium enemas, and calculated the mean Td of these tumours to be 195 days (range 79-2355 days). These tumours lacked a firm histological diagnosis at the time the first films were taken. Serial measurements can also be made of lung metastases by direct measurement and of hepatic metastases by ultrasound or CT scan. Steel (1977) calculated the Td of 56 colorectal lung metastases to be 95 days.
Tritiated thymidine provides a number of approaches to cell kinetic measurement. The thymidine labelling index (TLI) of colorectal tumours varies according to author and technique. Meyer (1981) showed no relationship between the TLI and tumour pathology or prognosis of 90 colorectal tumours. Using the Fraction of Labelled Mitoses (FLM) technique, Lipkin (1971) calculated similar cell cycle times (24-48 hours), S phase durations (10-20 hours) and G2 durations (more than eight hours) in both colorectal tumour and mucosa cells. Camplejohn (1982) reported that the cell generation time of colonic tumour cells was 3-7 days as compared to one day for normal mucosal cells. He studied 21 patients with colorectal tumours using the stathmokinetic technique with Vincristine induced metaphase arrest. The mean cell cycle time was 190 hours. He cited the problem of tumour heterogeneity as one reason for the wide variation in results on tumour kinetics published in the literature. Aherne (1977) showed differences in mitotic activity from site to site in human colorectal tumours. Petersen (1978) showed that some tumours have a variable ploidy from site to site. A selection of the published data for the labelling index of human colorectal carcinoma is shown in Table 2:1.
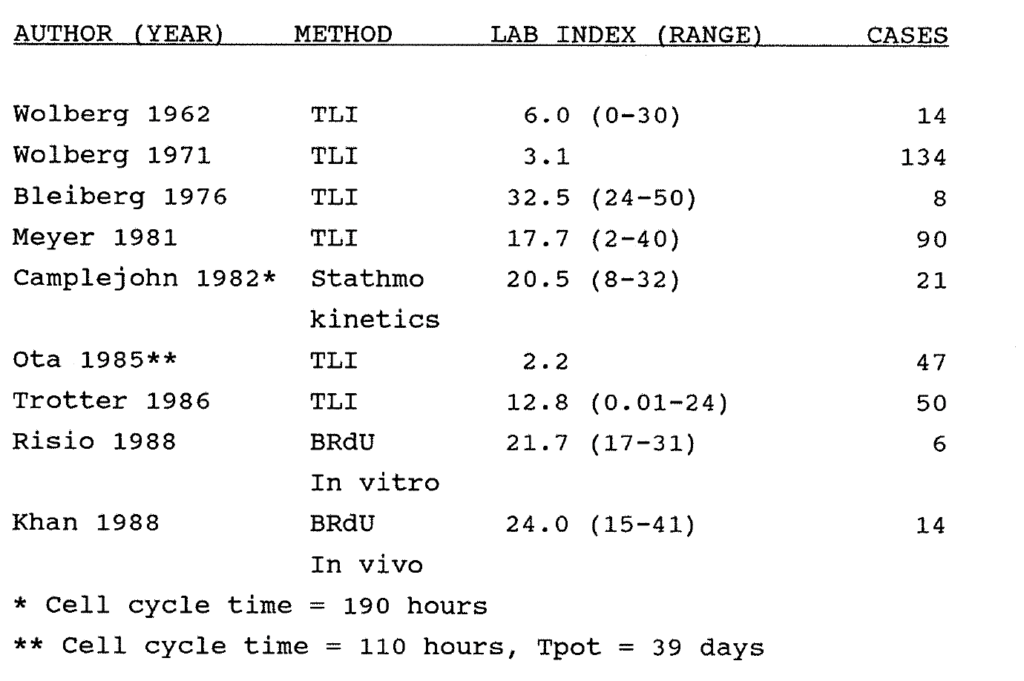
Table 2:1. Examples of reported series of Labelling Index data measured in human colorectal carcinomas. All isotope studies were performed in vitro.
Ota and Drewinko (1985) showed no difference in the thymidine LI of 47 tumours obtained from different anatomical sites in the colon and rectum. The median TLI of these tumours was 2.25%. They assumed a Ts of 24 hours and used Welin's data (1963), volume doubling time = 620 days, to calculate a cell cycle time of 4.6 days, a Tpot of 39 days and a cell loss fraction of 94%. They also found that cell suspensions produced by enzymatic digestion provided a more representative result than did tissue fragments incubated with 3H-Thymidine.
Owing to the limitations of radioisotope methodology, few meaningful studies relating TLI-derived kinetic data to prognosis with adequate numbers of patients are available. Trotter (1986) used an in vitro 3H-Thy pulse labelling technique to measure the TLI of tumour cells removed at surgery from 50 patients with colorectal tumours. He found a significant correlation between TLI and Dukes grading (vide infra), and demonstrated a trend towards a lower TLI in advanced tumours, unlike Meyer's findings (1981).
DNA ploidy measured by flow cytometry has been studied in archival human colorectal tumour specimens as a determinant of prognosis (see Hedley 1983, 1989, Barlogie et al 1983, Frankfurt 1984). Ploidy has also been studied in relation to the colorectal "Polyp-Cancer Sequence". Giaretti et al (1988) reported the DNA ploidy of 64 colorectal adenomas and 49 adenocarcinomas biopsied at colonoscopy. All 105 normal
mucosal specimens were diploid. 20 of 64 adenomas were aneuploid, the ploidy correlating with size and degree of dysplasia but not with histological type of adenoma. 36 of 49 tumours were aneuploid, with a mean DNA index of 1.63. Polyps showing malignant change in the stalk had a mean DNA index of 1.52. Follow up was insufficient to correlate these findings with prognosis. The same team reported a significant correlation between seven of nine patients with DNA aneuploidy in colorectal adenomas and a positive family history of colorectal cancer.
The ploidy of colorectal tumours has been compared both with histological grade and with tumour stage (Dukes). Wooley et al (1982) suggested that diploid tumours have a better prognosis than aneuploid colorectal tumours. Frankfurt (1986) found no relationship between DNA ploidy and tumour grade in the 50 renal, 91 colorectal and 50 ovarian carcinomas which were studied. Armitage (1985) studied the ploidy of 134 archival colorectal tumours. 54% of these were aneuploid and had a markedly worse five year survival than did the diploid tumours. In a study of 24 colorectal tumours by Teodori et al (1986), eight out of nine diploid tumours were in Dukes A or B categories, whereas 13 of the 15 aneuploid tumours (DNA index of 1.10- 2.71) were in Dukes C or D categories. In a study of 123 human colonic adenocarcinomas, Jones et al (1988) found that while DNA aneuploidy is associated with clinical and pathological (eg Dukes grading) features of aggressive malignancy, the determination of DNA ploidy is an incomplete measure of individual tumour cell behaviour. They concluded that ploidy measurement is presently unlikely to influence the management of patients.
Flow cytometry may also be used to study the relationship between the DNA content of primary tumours and associated metastases. For example, Frankfurt (1984) showed a significant difference in the degree of aneuploidy between a single primary (colonic) tumour and its metastasis.
Proliferation data has been obtained from the study of human tissue biopsies labelled in vitro with BRdU. Risio (1988) reported that the labelling index of normal mucosa and metaplastic polyps was significantly lower than in dysplastic adenomas and carcinomas. In a pilot study, Khan et al (1988) infused BRdU into 14 patients with metastatic colonic adenocarcinoma. Biopsies of tumour and normal mucosa were excised two hours later. Labelling was of good quality and highly specific. The mean labelling index of the tumours was 24% (range 15.0-40.6%). Other markers of colorectal tumour proliferation have also been proposed. For example, Shepherd (1988) measured the expression of the Ki-67 antigen in 108 fresh colorectal carcinomas by immunohistochemistry. The tumour labelling index ranged from one to 80% positivity, and there was no correlation with known prognostic parameters. The authors’ conclusion that Ki-67 may be useful in selecting patients for treatment appears to be optimistic on the basis of this data.
The volume growth of human tumours is governed by the balance between cell production and cell loss. Studies reported in the literature have to date used only the total LI or the DNA S phase fraction as measures of proliferation. These are static parameters which give no information on the dynamic aspects of cell production. The additional data of the aneuploid labelling indices, the Ts and the Tpot provided by multiparameter flow cytometry (FCM) have not previously been evaluated in colorectal cancer. The combination of DNA aneuploidy and proliferation data may give a better insight into the factors influencing biological aggressiveness.
2:3:1. Materials and methods.
Informed consent was obtained from all patients for injection of a single dose of 250mg BRdU (Takeda, Japan). Hospital Ethical Committee permission was obtained prior to commencement of the study. A flow chart of the procedure is shown in Figure 2:1.
2:3:2. Patients and specimens.
One hundred adenocarcinomas of the colon and rectum were studied from 97 patients, 54 males and 43 females, age range 42-90 years, mean age 74 years. Three female patients had two synchronous colonic tumours, each of which was studied.
2:3:3. Anatomical site.
There were 23 tumours in the caecum and ascending colon, four tumours in the transverse colon, nine tumours in the left colon, and 13 tumours in the sigmoid colon, a total of 49 colonic tumours. There were 51 rectal tumours.
2:3:4. Histological grading.
Standard Haematoxylin and Eosin stained sections of tumour were assessed by one consultant pathologist and reported as well, moderately or poorly differentiated. Where the degree of differentiation varied within a tumour, the tumour was classified for study purposes by the least differentiated area of the tumour. Five were well differentiated, 65 were moderately differentiated and 30 were poorly differentiated.
2:3:5. Dukes Staging.
Tumour resection specimens were each assessed by one consultant pathologist and lymph nodes were sought and counted. In three cases, endoanal surgery was performed and the Dukes stage could not be assessed. Six patients had Dukes A tumours, 39 patients had Dukes B tumours, and 52 patients had Dukes C tumours.
2:3:6. Specimen selection.
In order to assess intra-tumour variability of the DNA profile and proliferation indices, and to improve statistical accuracy, multiple wedges of tumour were excised from the peripheral quadrants and the centre of a number of tumours, as shown in Table 2. Wedges of tumour measured 0.5cm or more in radius, and allowed for multiple flow analyses if required.
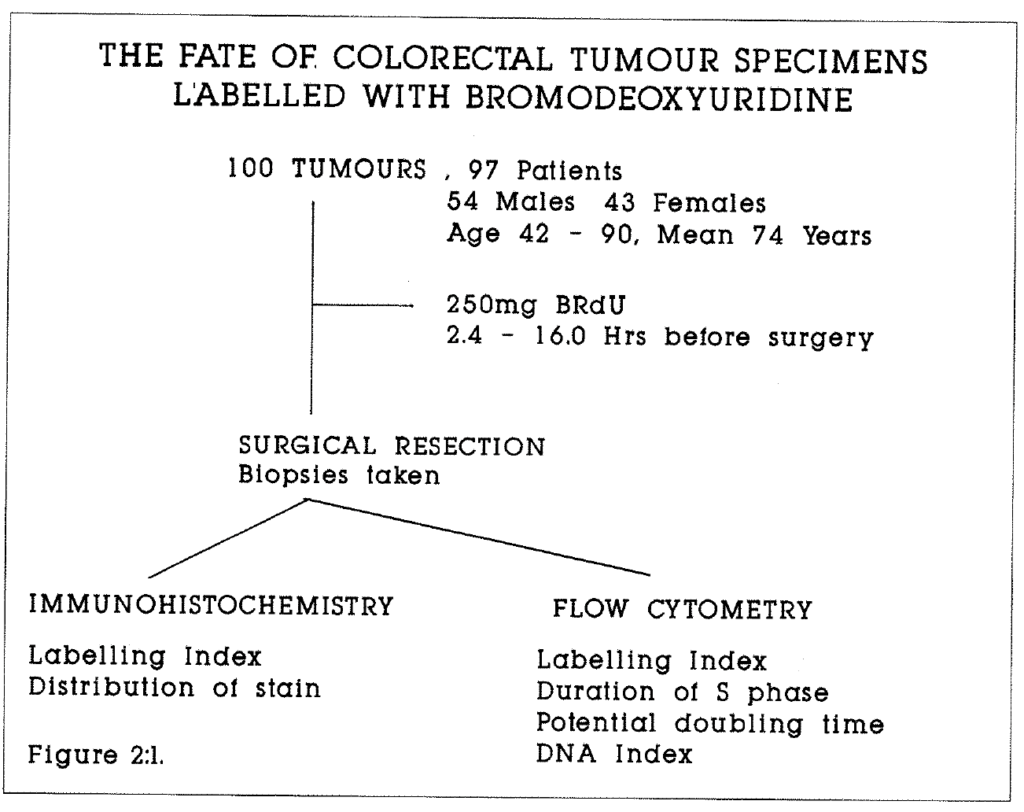 Figure 2:1. This flow chart illustrates the use of specimens in this study.
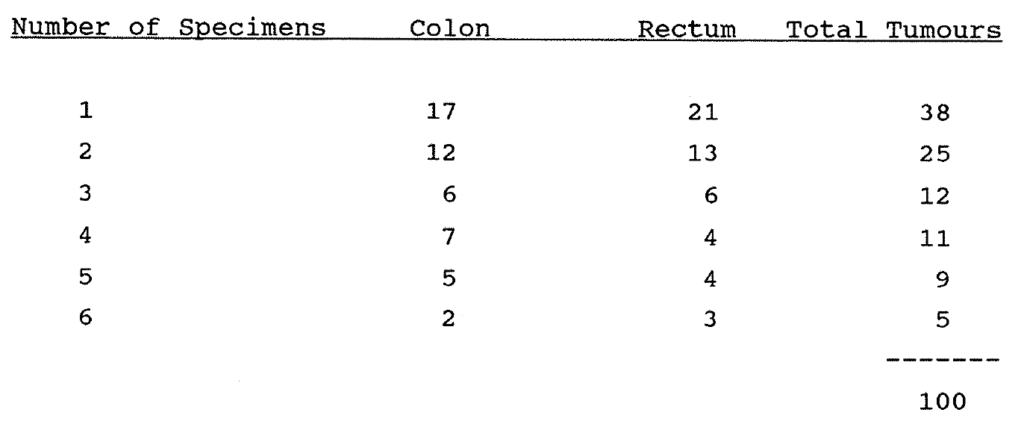
Table 2:2. Multiple specimens were studied from 62 tumours in the series. This table shows the distribution of this data with regard to the number of specimens per tumour.
Four biopsies of liver metastases and two of a large adrenal metastasis were obtained. Kinetic data were available on 10 extra-abdominal late recurrences from eight patients for whom primary tumour kinetic data were not available. All specimens were stored in 70% ethanol or 70% methylated ethanol in a commercial freezer at minus 4°C. Shelf life with preservation of BrdU content has been established as at least one year in this mode.
2:3:7. Processing of specimens for Flow Cytometry.
Specimens were processed in batches of 28. Tissue was disaggregated by mechanical dissection, and fragments were incubated in 8mls porcine pepsin (Sigma) solution in 0.1M Hydrochloric acid (HCl) at a concentration of 0.4mg per ml for 45 minutes at 37°C while undergoing agitation. The resulting suspension was filtered through a 35 micron mesh and centrifuged at 1500 rpm for five minutes to select the nuclei. Nuclei were resuspended in 3ml 2M HCl for 13 minutes at room temperature so as partially to denature DNA. Nuclei were then washed twice in fresh Phosphate Buffered Saline (PBS). The concentration of nuclei was adjusted to approximately two million per ml.
2:3:8. Incubation with Anti-BRdU monoclonal antibody.
Nuclei were resuspended in a solution of 0.5ml of PBS containing 0.5% Tween 20 (Sigma), 0.5% normal goat serum (NGS) and 25 microlitres of anti BRdU antibody (Seralab). Incubation proceeded for one hour at room temperature. Nuclei were then washed twice in PBS.
2:3:9. Staining with goat anti-rat antibody-FITC conjugate
Nuclei were resuspended in 0.5ml 0.5% Tween/NGS/PBS and 25 microlitres of goat anti-rat antibody (whole molecule) fluorescein (FITC) conjugate (Sigma) were added. Incubation proceeded for one hour at room temperature. Nuclei were then spun and washed twice in PBS.
2:3:10. DNA counterstaining with Propidium Iodide.
Nuclei were resuspended in 2ml PBS with 30 microlitres of 1.0mg/ml Propidium Iodide (Sigma).
2:3:11. Data collection and analysis by flow cytometry.
Analyses were carried out as described by Wilson et al (1988). All analysis was performed on an Ortho Systems 50-H Cytofluorograph with a 5W Argon ion laser which excites at 488nm light wavelength. Green fluorescent light (FITC) was collected at 510-560nm and red fluorescence (PI) above 620nm. All data on fluorescent events were collected by the computer in list mode. The data were gated to exclude multiple nuclei on the DNA peak versus area signal. Data for 10-15,000 nuclei were collected from each specimen. Details of the mathematical analysis were given in Chapter 1.
2:3:12. Immunohistochemical localisation of BRdU.
Flow cytometric analysis provides a total tissue BRdU labelling index. Quantitative studies of cell labelling were also performed on selected tissue sections stained immunohistochemically. Details of the immunohistochemical staining technique are given in Appendix 2:C. Sections were cut and satisfactorily stained from 26 tumour blocks. The BRdU labelling index was estimated in each section by counting a mean of 2,000 cells per section (10 random fields, 200 cells per field) at x40 magnification using a standard microscope. The "visual" BRdU labelling index was the ratio of the BRdU stained cells to the total number of cells in each field. Examples of BRdU labelling of a colorectal tumour are given at the end of the chapter.
2:4:1. Results
It was possible to measure BRdU labelling satisfactorily in at least one tissue block from every tumour studied. The DNA histograms were unsatisfactory for measurement of the Ts and the Tpot in only two tumours. In these cases, the DNA appeared to be unduly sensitive to disaggregation in concentrations of pepsin of 0.1-0.4 mg/ml over 15 to 45 minutes, and with denaturation in 2M HCL over five to 15 minutes. The reasons for this phenomenon were unclear.
Typical histograms obtained from diploid and aneuploid tumours are shown in Figures 2:2 and 2:3. In each example, the majority of labelled nuclei are still in the S phase of the cycle, between the G1 diploid and aneuploid and the G2 peaks, but some have already passed through G2M. Their label has reappeared in the G1 diploid and aneuploid populations of the next cell cycle. This label is clearly seen in the G1 peaks on the left side of each BRdU histogram.
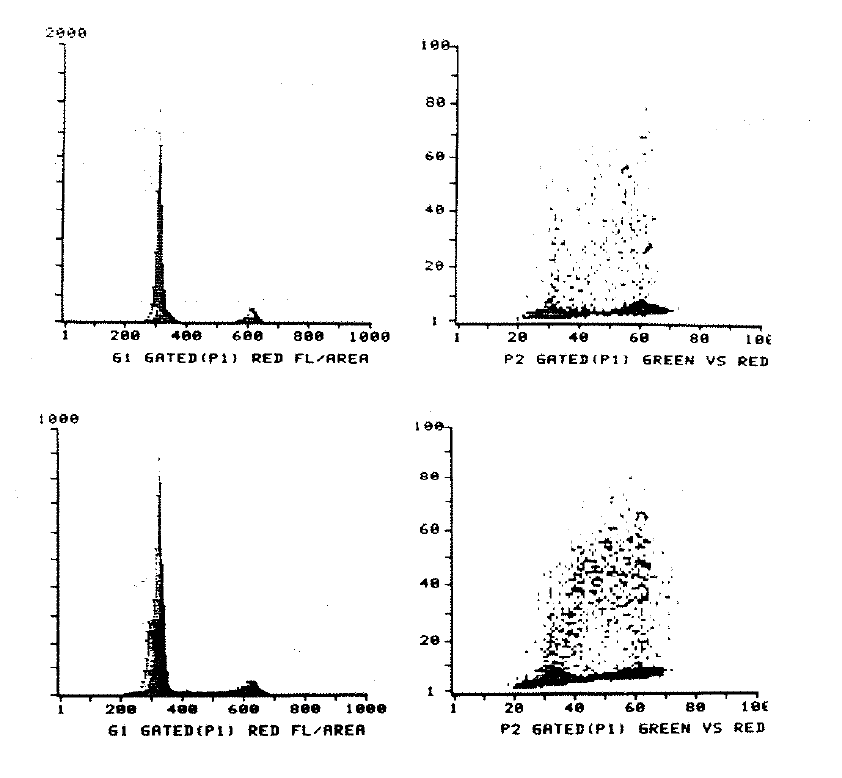
Figure 2:2. The upper left histogram shows the ploidy profile and the upper right histogram the relationship of the BRdU uptake to the phases of the cell cycle of a specimen of normal colonic mucosa (code COL008). The lower histograms show similar data from the sigmoid colon tumour of the same patient. There is significantly more BRdU labelling in the tumour specimen. Histograms were printed from the computer at the time of analysis.
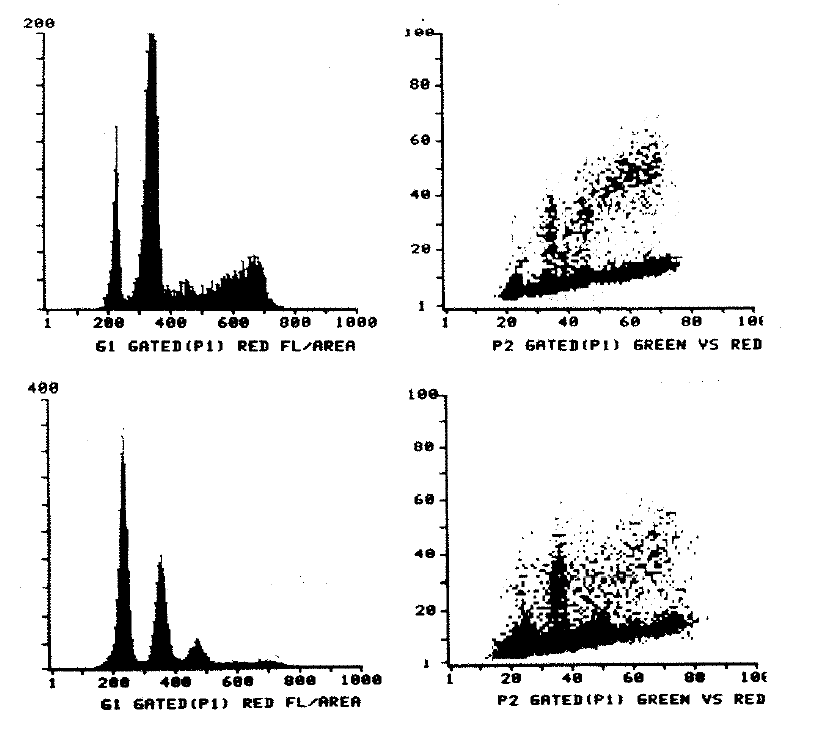 Figure 2:3. This shows two examples of aneuploid tumours with DNA profiles on the left, and their BRdU content on the right. The association of BRdU content with the G1 diploid and aneuploid peaks can be seen. The DNA index of the sigmoid tumour (COL026) was 1.53 and of the left colon tumour (COL001) was 1.54.
The mean DNA content and the number of labelled and unlabelled nuclei in any region of interest on the histograms were calculated by setting a gate. In the case of diploid histograms, gates were set around the total labelled population of nuclei to derive the labelling index, and around the BrdU labelled nuclei in G1. These cells have divided and shared their BrdU between two daughter cells in the time between injection and biopsy. The LI can be corrected to its true value at the time of injection by halving the number of labelled nuclei in G1 and subtracting it from the total labelled population. Regions were set around the total G1, total G2 and labelled S phase nuclei to measure the relative movement of S phase cells through the cell cycle in the period between injection and biopsy, assuming an even distribution of label through the S phase at time zero (T0). In the case of aneuploid BrdU histograms, both total and aneuploid labelling indices were calculated by setting further regions according to DNA content. Ts and Tpot calculations were made on the aneuploid population, thus excluding labelled stromal nuclei.
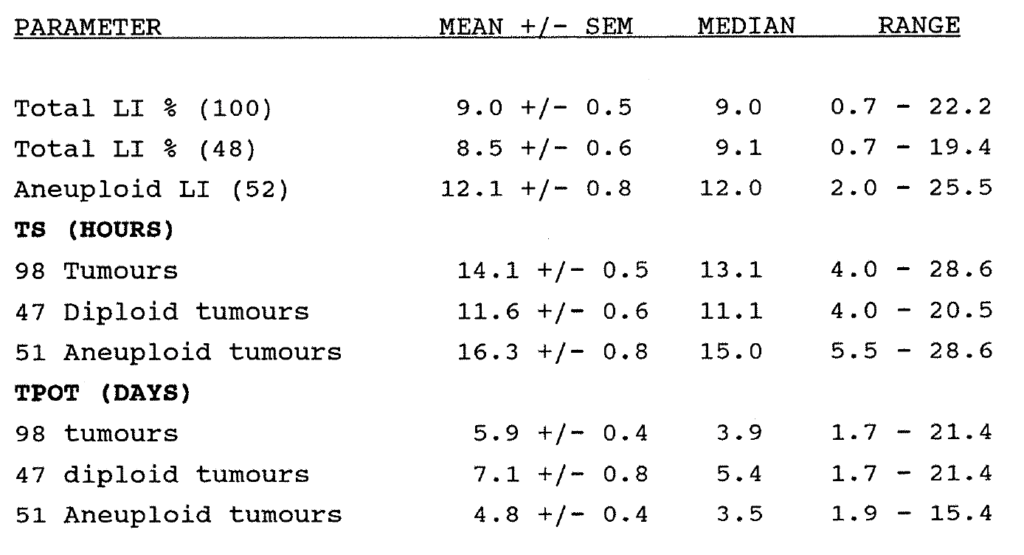
Table 2:3. Summary of aggregated results of the kinetic data measured in 100 primary colorectal carcinomas.
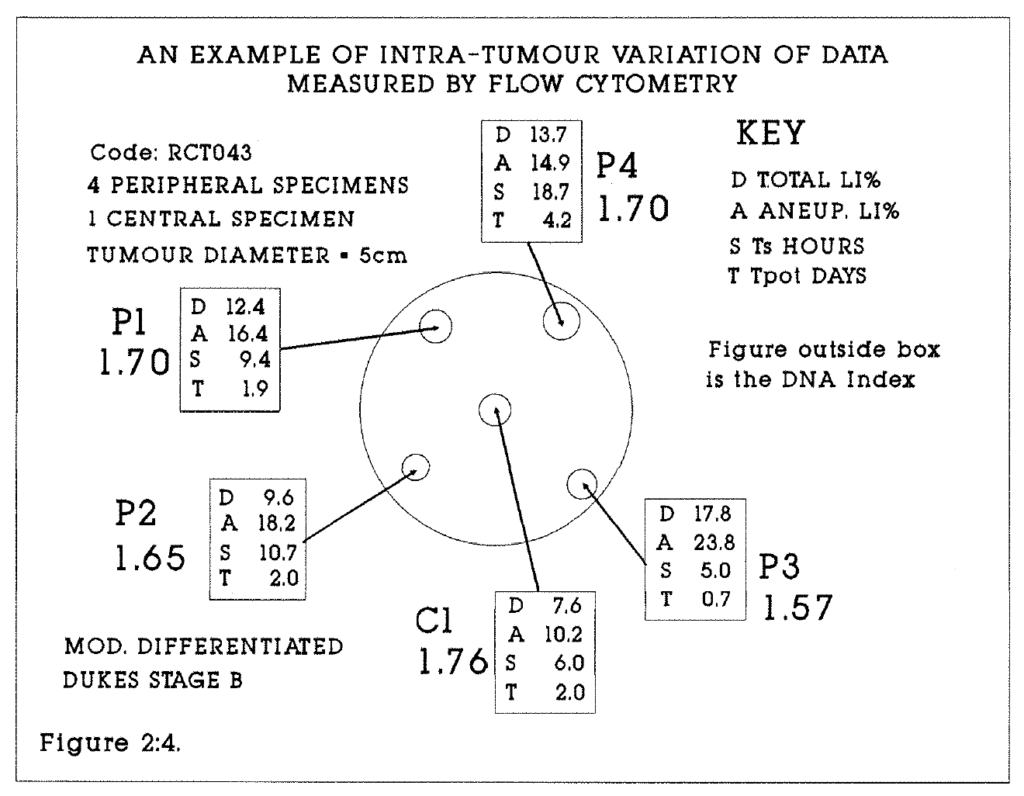
Figure 2:4. An example of the biopsy procedure for multiple specimens is given in this diagram, with kinetic data illustrating variation at different sites within the tumour.
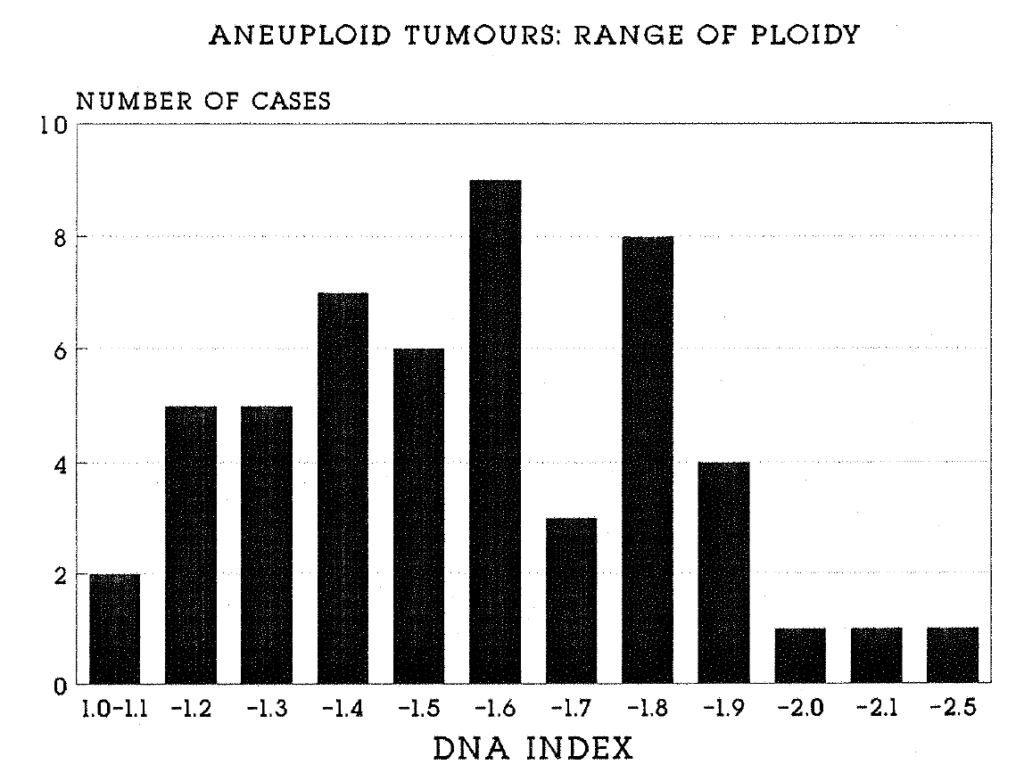
Figure 2:5. This histogram shows the distribution of the 52 aneuploid tumours in the study in relation to their ploidy. The X axis is marked at 0.1 (10%) intervals. One tumour fell in the range of values 2.4-2.5.
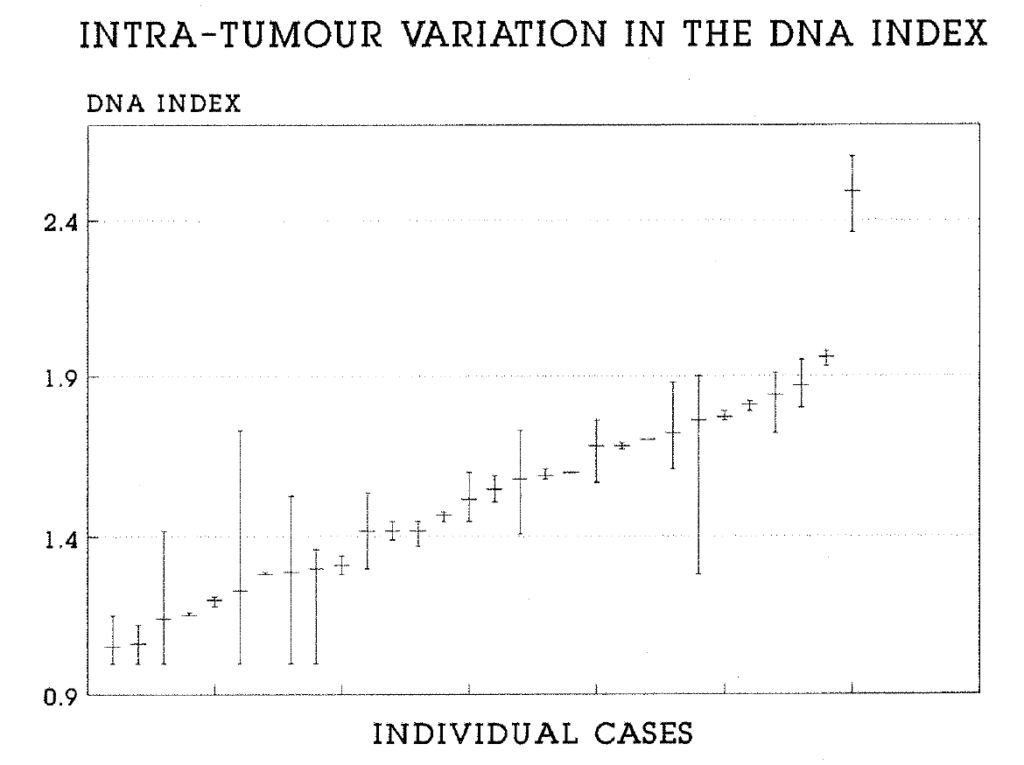
Figure 2:6. This plot shows the range of ploidy values for 30 aneuploid tumours in which multiple specimens were analysed. Shown are the mean and the range of the data for each tumour.
2:4:2. The DNA profile.
There were 48 diploid and 52 aneuploid tumours, (range 1.1-2.4). Of the aneuploid tumours, three were well, 36 moderately and 13 were poorly differentiated. A histogram of the range of ploidy values is shown in Figure 2:5. Multiple tumour blocks were studied from 61 of the 100 tumours. 30 tumours showed diploidy in all blocks studied. In a further nine tumours, separate diploid and aneuploid populations were detected in different blocks. In these cases, the tumours were regarded as aneuploid and the overall tumour ploidy was calculated to be the mean of all ploidy values, accepting the limitations of this owing to sampling errors. The variation in the interspecimen range of the DNA Index of tumours from which multiple biopsies were analysed is shown in Figure 2:6.
2:4:3. The total and aneuploid labelling indices.
The mean total labelling index of 100 tumours was 9.0%, (Range 0.7-22.2%, median 9.0%). The mean aneuploid labelling index of 52 tumours was 12.0%, (range 2.0-25.5%, median 12.6%). This is shown on the histogram, Figure 2:7. A significant difference was found to exist between the total (100 tumours) and the aneuploid (52 tumours) labelling indices when tested by both parametric and non parametric methods. (The Student T test and Mann Whitney tests were used, p = 0.001). This is to be expected, because calculation of the total LI is based both on tumour nuclei and largely unlabelled stromal nuclei, whereas the aneuploid population is composed entirely of tumour nuclei. This difference also existed when the total LI and the aneuploid LI of aneuploid tumours alone were compared. There was no difference between the total labelling index of 48 diploid and 52 aneuploid tumours, suggesting that the proportions of non proliferating cells in each type of tumour are similar. Because the aneuploid LI in those tumours with abnormal stem lines was on average 25% greater than the total LI of those tumours, the data provide an indication as to the underestimate of tumour cell proliferation in diploid tumours due to the inability of flow cytometry to discriminate tumour and stromal nuclei (see Steel 1977).
In aneuploid tumours, a further indication of the proportion of tumour cells in the aneuploid and diploid populations is obtained by measuring the percentage of hyperdiploid cells in the population. (This includes "diploid" cells in S and G2M.) In our series, this ranged from 43 to 90%. In those tumours with a high diploid fraction, it is likely that a significant proportion of the diploid cells are malignant rather than stromal, in other words that these tumours contain both diploid and aneuploid malignant cell lines. The range of intra-tumour variation in proliferation was studied in 62 tumours (Table 2:2). In 59 tumours the total LIs of multiple quadrant blocks were compared. Intratumour variation ranged from 0 to 20%, reflecting heterogeneity of proliferation. Generally, the greatest variation was between marginal blocks and more necrotic central tumour blocks. The range of interspecimen variation for these tumours is shown in Figure 2:8.
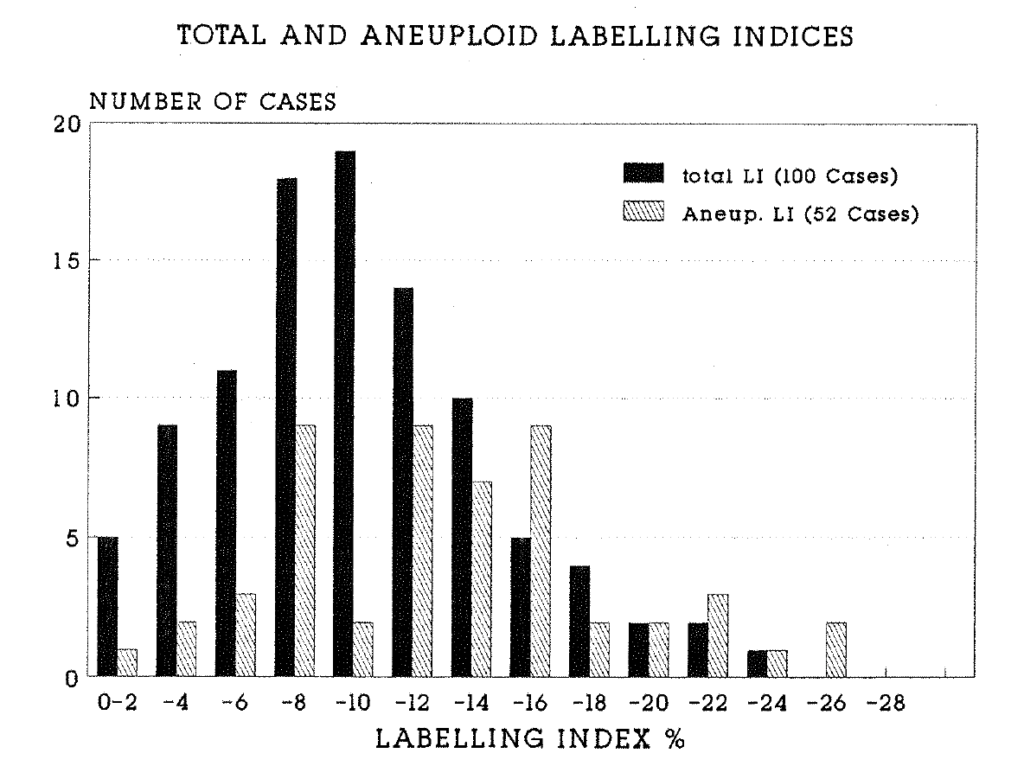
Figure 2:7. This histogram compares the distribution of the total labelling index of all 100 tumours and the aneuploid labelling index of 52 aneuploid tumours. The mean and median aneuploid labelling indices were significantly higher (p=0.001).
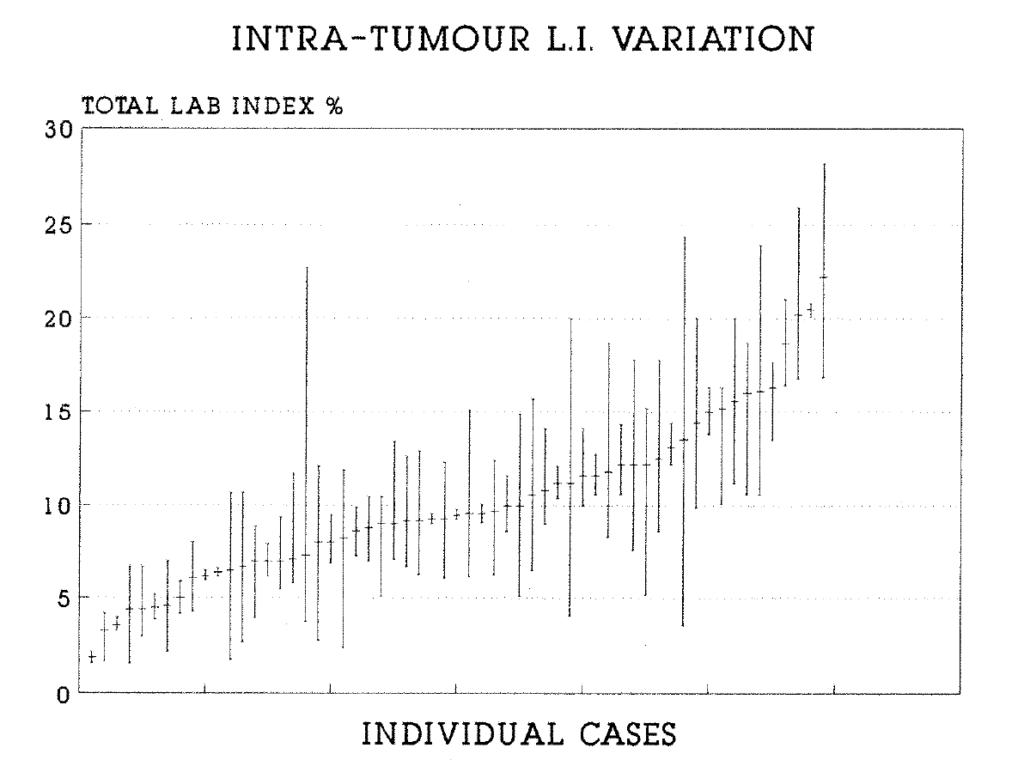
Figure 2:8. This plot shows the range of total labelling index values for 59 tumours in which multiple specimens were analysed. Shown are the mean and the range of the data for each tumour.
2.4.4. The S Phase Duration
The mean S phase duration of 98 evaluable tumours was 14.1 hours, (range 4.0-28.6 hours, median 13.6 hours), with a univariate distribution. A significantly longer Ts was found in the aneuploid tumours (two sample analysis of variance, p = 0.001), which reflects the longer time required to duplicate the larger quantity of DNA in these tumours (Figure 2:9). Interspecimen variation in the Ts occurred within tumours (Figure 2:10). This may reflect in part a variation in the proportions of different cell lines in different specimens. It cannot necessarily be concluded that any one cell line has a constant Ts.
2.4.5. The Potential Doubling Time
The mean potential doubling time was 5.9 days (range 1.75-21.4 days, median 3.9 days), with a univariate distribution. The Tpot of aneuploid tumours was significantly shorter than that of diploid tumours, (3.5 versus 5.4 days, two sample analysis of variance, p = 0.001) (Figure 2:11). Where multiple blocks were studied, intratumour variation of the Tpot (Figure 2:12) reflected the heterogeneity of the total labelling index and of the Ts. 40 of 59 tumours had an absolute range of variation of the Tpot of less than five days, but seven tumours had a range of variation of greater than 10 days. This reflected a high percentage variation in the Tpot in these tumours. Thus, reliance on a single biopsy to calculate the Tpot would result in mis-classification of a significant number of tumours as rapidly or slowly proliferating.
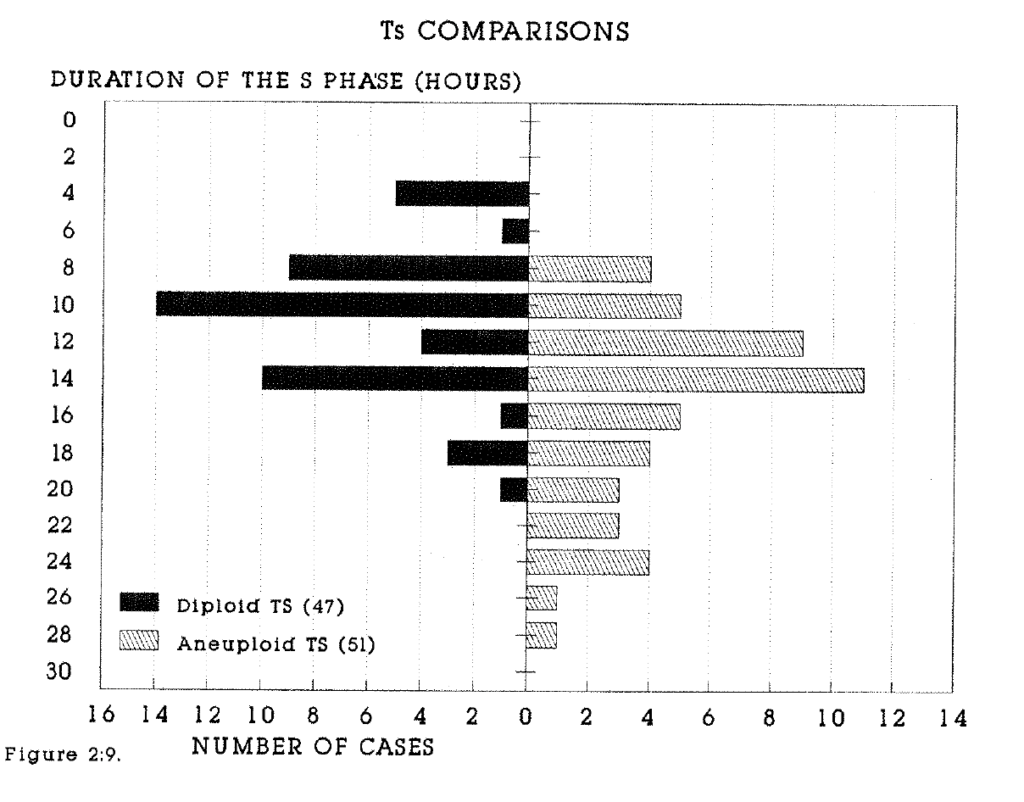
Figure 2:9. Histograms of the S phase duration (hours) of 47 diploid and 51 aneuploid tumours demonstrate the longer Ts in aneuploid tumours.
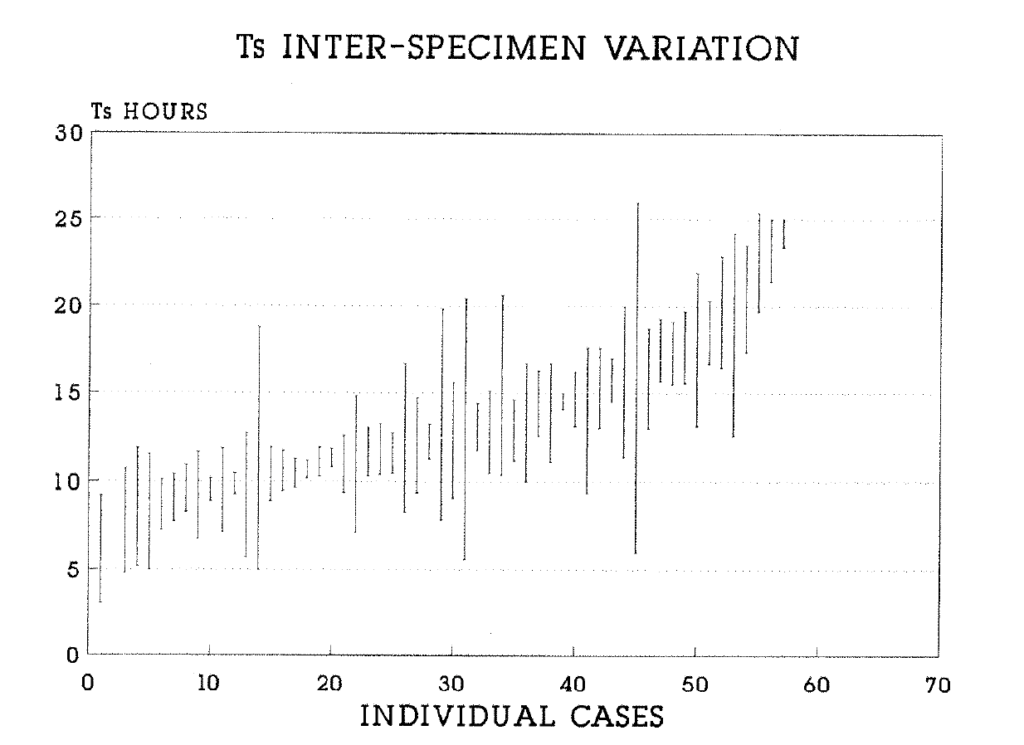
Figure 2:10.This plot shows the range of variation of the Ts in 57 tumours in which multiple specimens were analysed. Shown are the mean and the range of the data for each tumour.
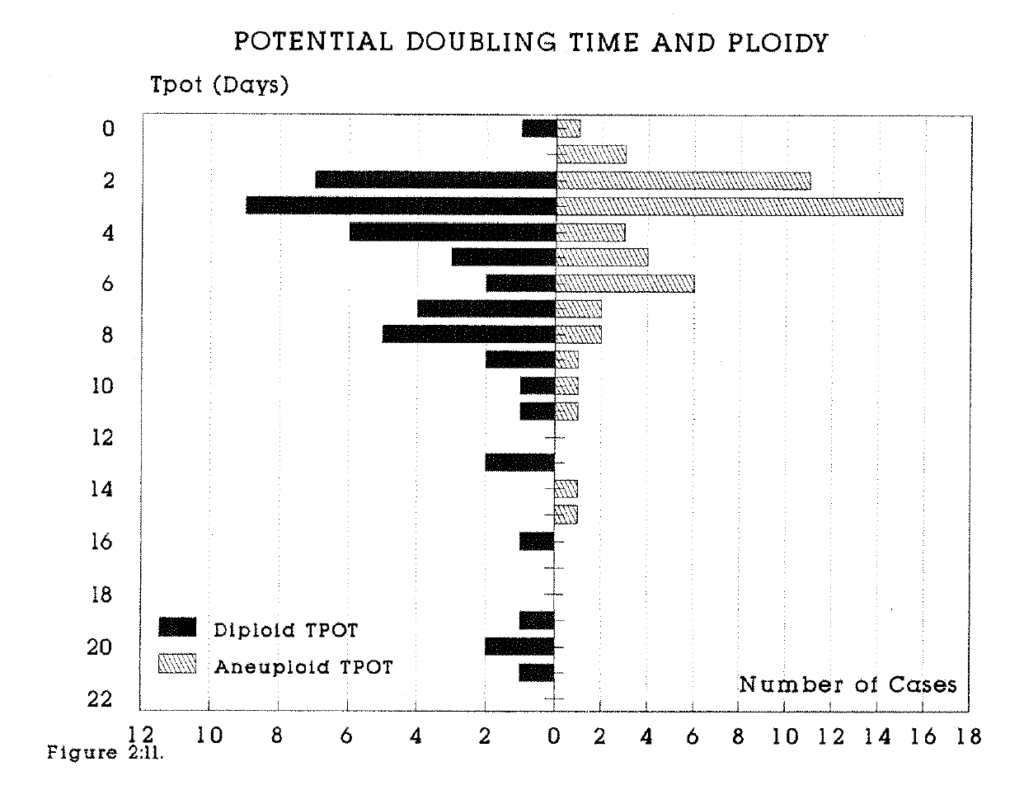
Figure 2:11. Histograms of the potential doubling time (days) of 47 diploid and 51 aneuploid tumours demonstrate the significantly longer Tpot in aneuploid tumours.
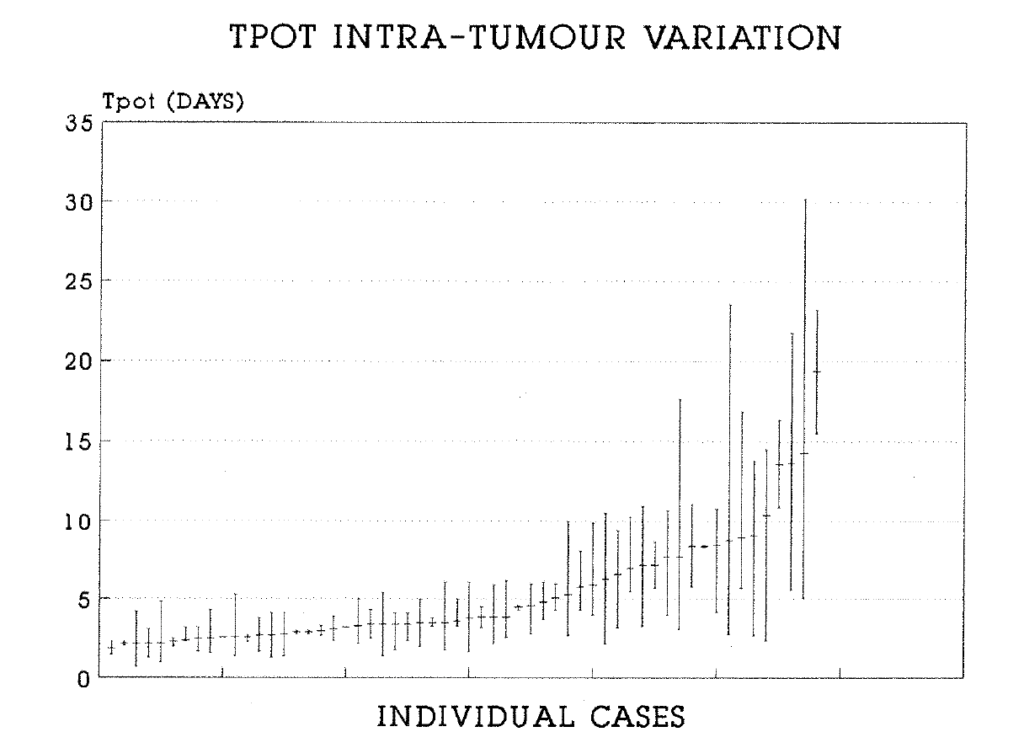
Figure 2:12. This plot shows the range of variation of the Tpot in 58 tumours in which multiple specimens were analysed. Shown are the mean and the range of the data for each tumour.
2:4:6. The Kinetics of extra-intestinal metastases.
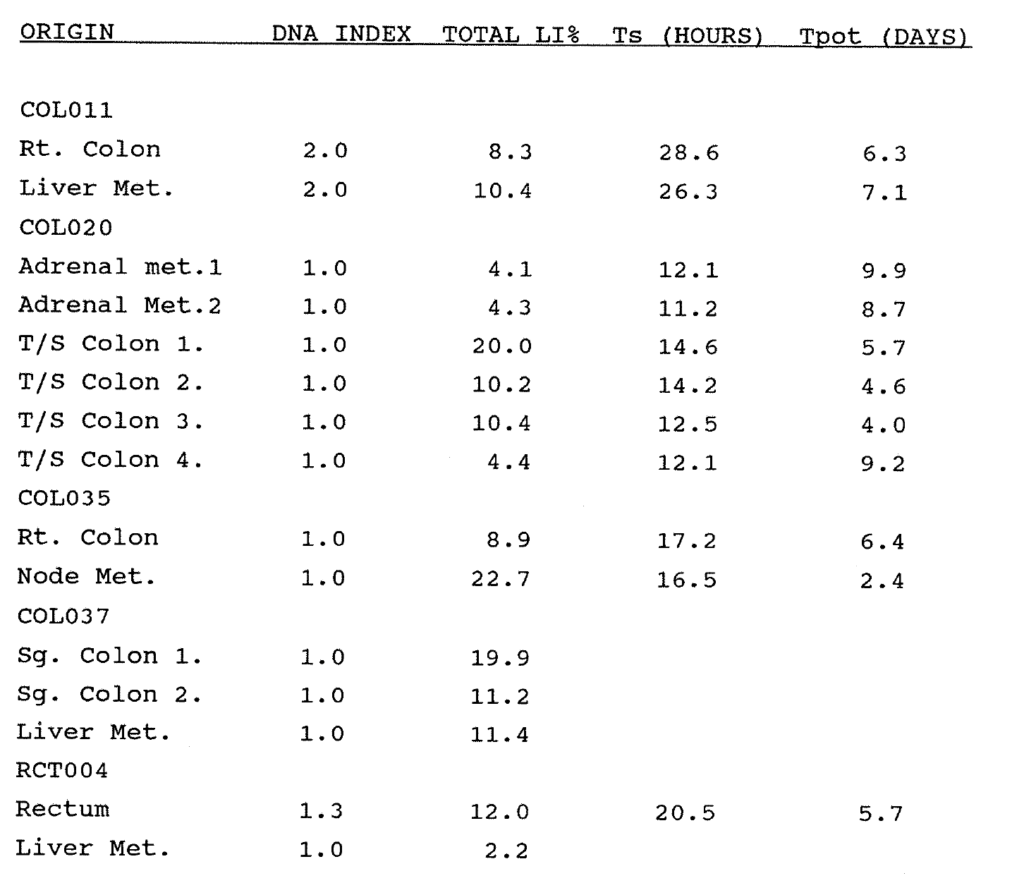
Table 2:4. Five primary tumours with analysed metastases were studied. The kinetic data are given where available.
Four hepatic and two adrenal metastases were studied in association with five primary adenocarcinomas. The data comparing the primary and metastatic tumours are shown in Table 2:4. 10 specimens were studied from eight patients presenting for adjuvant therapy with recurrent tumour in the perineum, inguinal lymph nodes or subcutaneous deposits. In two specimens, only the labelling index was obtained. In the other eight specimens, the full range of kinetic parameters was measured. Kinetic data on the primary tumours were not available. Eight specimens were diploid and two were aneuploid, values 1.53 and 1.60. The mean labelling index was 10.2% (range 2.5-17.3%). The mean Ts of eight specimens was 22.1 hours (range 9.6-30.7 hours). The mean Tpot was 8.9 days (range 2.6-28.9 days).
2:4:7. Correlation of kinetic data with Histological Grade.
There was no relationship between the histological grade and the total labelling index in 100 tumours (Figure 2:13). In order to assess whether there was an increase or decrease in proliferation with grade, both parametric (Student t-test) and non parametric (Mann Whitney, Wilcoxson) tests were performed on the populations of 65 moderately and 30 poorly differentiated tumours. There were no significant differences by either test. There were too few well differentiated tumours for statistical significance. The same tests were performed to compare the aneuploid labelling indices of 36 moderately and 13 poorly differentiated aneuploid tumours, and again there were no significant differences by either test. There was no relationship between the DNA Index of the aneuploid tumours, the Ts or the Tpot (Figure 2:14) and the histological grade.
2:4:8. The correlation of kinetic data with Dukes stage.
There was no relationship between the total labelling index and the Dukes stage (Figure 2:13). In order to assess whether there was an increase or decrease in proliferation with stage, both parametric (Student t-test) and non parametric (Mann Whitney, Wilcoxson) tests were performed on the 39
Dukes B and 52 Dukes C tumours. There were no significant differences (p = 0.001) by either test. There were too few Dukes A tumours for statistical significance. There were no significant differences (p = 0.001) by either test when the Tpot of the 36 aneuploid Dukes B and 13 aneuploid Dukes C tumours were compared. There was no relationship between the DNA index of 52 aneuploid tumours, the Ts or the Tpot (Figure 2:14) and Dukes stage.
2:4:9. Intra-specimen variation.
The range of experimental error in the method was addressed in six randomly chosen tumour blocks from six patients. From each block six immediately adjacent specimen samples were excised and separately disaggregated for flow cytometry. Results are shown in Table 2:5. In two of the blocks there was a wide variation in data obtained, but in each case this derived from only one of five specimens. In general, greater variation of data was found between peripheral and central tumour blocks of large tumours, reflecting necrosis and poor vascularity in the centre, but this was not a consistent pattern.
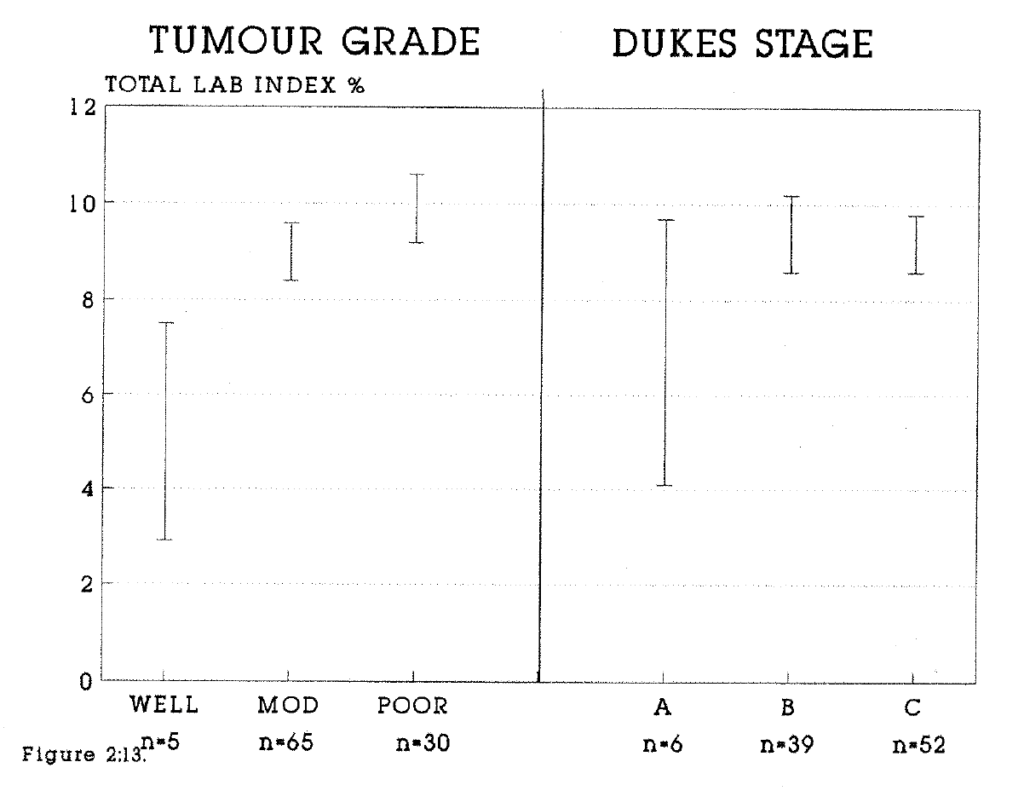
Figure 2:13. The total labelling indices of the well, mod(erately) and poorly differentiated tumours have been compared. The mean values and the standard errors have been plotted. n = the number of tumours in the sample. For comparison, similar data relating to the Dukes stage (A, B or C) have been plotted. There were too few Well differentiated or Dukes A tumours for valid statistical comparisons.
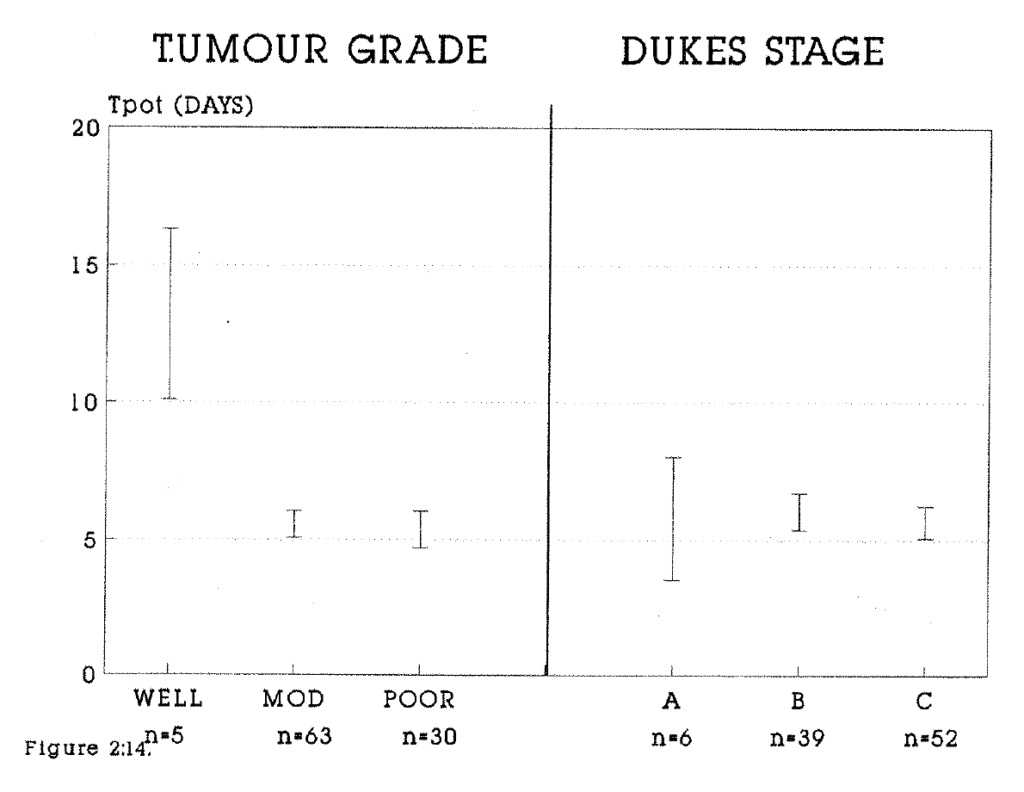
Figure 2:14. The potential doubling times of the well, mod(erately) and poorly differentiated tumours have been compared. The method of presentation and analysis is as for Figure 2:13.
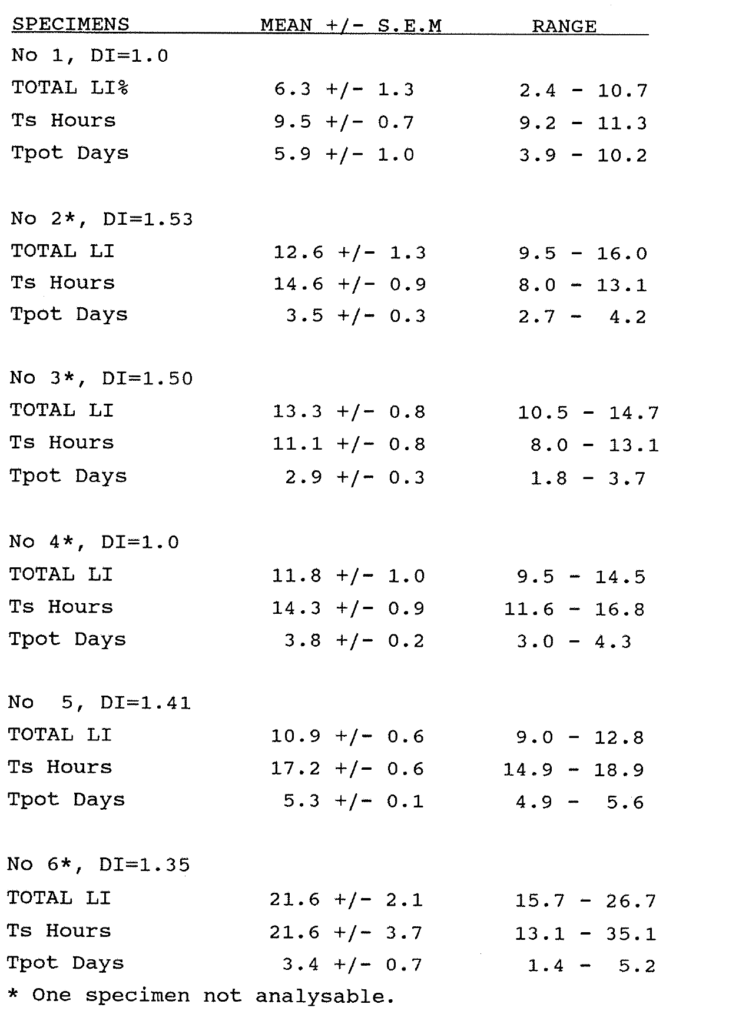
Table 2:5. This table shows the range of data within single blocks from six different tumours. Six specimens were separately analysed from each block.
2:4:10. Measurement of the Labelling Index in Tissue Sections
Most of the historical data on labelling indices have been obtained from measurements on histological sections. The correlation between flow cytometric and histological labelling index data have not been assessed. A limited study was undertaken to investigate this relationship. The BRdU labelling index was measured visually in 26 stained sections of different colorectal tumours from this series. Because of stain heterogeneity, areas of strong staining were selected for counting. These may have been unrepresentative of the entire tumour. The mean Visual LI of these sections was 17.6% (median 17.2%, range 4.3-33.7%). The results were compared with the uncorrected total labelling index measured by flow cytometry in nearby blocks from the same tumour specimen. The uncorrected LI is the nearest approximation to the findings on stained sections, because the figure includes G1 cells labelled with BRdU which have divided since pulse labelling. These are the cells whose labelled nuclei comprise a second generation population within the G1 diploid peak on the DNA histogram. The mean value of the FCM specimens was 11.3% (median 10.1%, range 4.1-24.7%). There was a significant difference between the labelling index measured by each technique by Two Sample Analysis (p = 0.01). The results were plotted against each other and the best fit line of the trend was drawn (Figure 2:15). Linear regression analysis gave a correlation coefficient between the methods of 0.53.
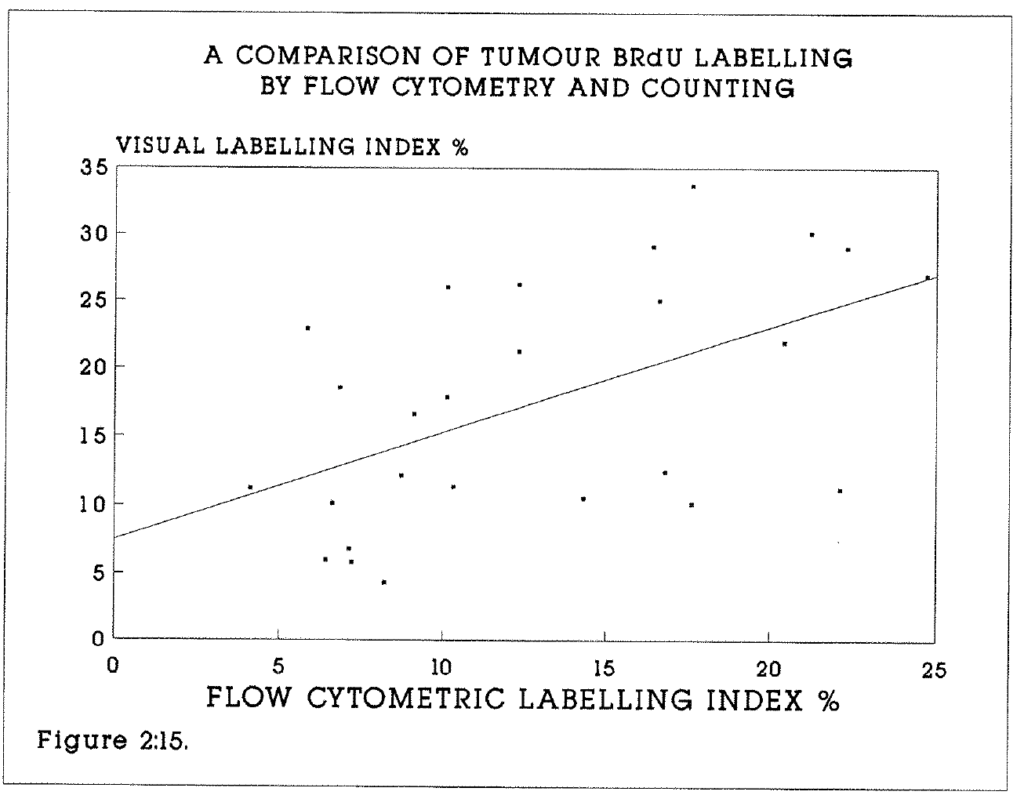
Figure 2:15. This shows the correlation between the flow cytometrically and visually measured BRdU labelling indices of 26 tumours in this series. Pairs of samples for FCM and histochemistry were derived from one tumour in each case but there was not exact equivalence between these samples. The line drawn is the best fit of the trend.
In all but five tumours the FCM-LI was lower than the Visual LI. This may be in part due to differences in the effect of fixative (70% ethanol vs formalin and paraffin embedding), but also to loss of DNA containing antigen during nuclear extraction in preparation for flow cytometry. Conversely, BRdU staining of histological sections may include either antigen binding to cytoplasmic proteins and nucleic acids, or unrecognised antibody crossreactivity. This would lead to an overestimation of the immunohistochemical LI. The findings imply that labelling indices calculated by FCM and immunohistochemistry are similar although not directly comparable. It cannot be assumed that either of the two methods measures the "true" BRdU labelling index, although flow cytometry is less prone to observer error and fatigue, and counts many more labelled nuclei.
2:4:11. Clinical follow-up.
Follow up as of 31st December 1989 was one month to 19 months. 12 patients have died in the intervening period. Three early post operative deaths occurred due to bronchopneumonia (1), renal failure with cirrhosis (1) and peritonitis (1). Nine patients have died of progressive disease. There have been four proven metastatic recurrences. Clinical follow-up is continuing so that the relationship between the kinetic data and prognosis may be established.
2:4:12. Clinical safety of BRdU.
At the time of injection, no acute events such as nausea, vomiting or anaphylaxis were reported or observed. The risk of anaphylaxis must be considered if patients are to have repeat injections for the measurement of the kinetics of metastases. The full blood count (particularly platelet count and white cell count) and renal function were monitored postoperatively. There were no abnormalities in any of these parameters which could be attributed to BRdU. There were two deep venous thromboses in elderly patients. Each of the early postoperative deaths not caused by tumour progression was fully explained by the course of clinical events and the previous health of the patient. Post mortems were performed to confirm the cause of death wherever the consent of relatives was obtained.
2:5:1. Discussion.
This chapter has described the application of in vivo techniques to the measurement of cell proliferation kinetics of human colorectal tumours. The method improves the quality and quantity of cell kinetic data by measuring both static and dynamic characteristics. All characteristics show both inter-patient and intra-tumour variation. As with all biological techniques there are sources of experimental error inherent to the methodology (Begg 1985, Wilson 1985, 1988). An attempt has been made to evaluate data obtained from a single biopsy by studying the heterogeneity of proliferation.
The mathematical calculations upon which cell cycle kinetic measurements are based make the important assumption that the 3H-Thy or BRdU bolus is handled as a true pulse label following injection. This assumption may not hold at the cellular level. BRdU delivery requires trans-membrane and intra-cellular transport to the nucleus, where it will be in competition with endogenous thymidine for incorporation into DNA. Pulse labelling may therefore fail to identify all S phase cells. Hamilton and Dobbin (1985) found that the mean Thymidine LI of mouse carcinoma NT cell line tumours was increased from 27% to 46% by pretreatment with fluoro-deoxyuridine (See Figure 1:3). This blocks the enzyme thymidylate synthetase and the de novo synthesis of thymidine monophosphate from deoxyuridine monophosphate. It was concluded that they had provided evidence for the existence of a large cellular endogenous nucleotide pool which could not be saturated with a single injection of 3H-deoxyuridine monophosphate. This work has not subsequently been substantiated, and it is not certain that BRdU uptake is competitively inhibited by local nucleotides. This would have the practical effect of reducing the proportion of S phase DNA labelled with BRdU.
Disaggregation of tissues into constituent nuclei is an empirical and tissue specific technique. It is assumed that pepsin digestion shows no specificity for tumour or stromal cells, so that the nuclear suspension contains representative fractions of nuclei from all cell types. Labelling of non-epithelial cells with BRdU, particularly lymphocytes, can be demonstrated histochemically. It is not possible to distinguish tumour from stromal nuclei in the diploid histogram. The contribution of labelled non-tumour nuclei in any profile cannot be known with precision, but qualitative histochemical assessment indicates this figure to be 5% or less in most specimens. Where available, the aneuploid profile of tumours is used to calculate the Ts and Tpot, because this profile is assumed to be composed entirely of tumour cells.
Interpretation of the histogram is operator dependent and therefore subject to observer error. The setting of gates on the BRdU histogram may introduce an error of up to 5%. In particular, the late S phase merges with the G2/M phase labelled nuclei, which may lead to an artificially high calculation of the mean DNA content of the labelled cells in the S phase and hence of the Ts if the duration of G2 exceeds 2-3 hours. Where there was doubt about interpretation of either the DNA profile or the BRdU labelling, a further sample from the block was stained and analysed.
The range of tumour labelling index data measured by in vivo BRdU labelling in histological sections is broadly comparable with historical data (Lipkin 1963, Lipkin 1971, Aherne 1977, Bleiberg 1977, Camplejohn 1982). Multiparameter flow cytometry appears to offer no information gain in the measurement of a labelling index alone. Its advantage is to relate proliferation to the phases of the cell cycle. This reveals the differential labelling of diploid and aneuploid populations where present. The important feature is that it allows the analysis of time-dependent cell cycle progression. Time dependent data have been obtained by thymidine labelling of colorectal tumours only in limited studies. It appears that tumours have a much higher proliferative potential than is manifested in the actual growth rate. This may be for several reasons.
The first is cell loss by exfoliation. Exfoliation of both viable and dead cells into the bowel lumen has been demonstrated and can be used to diagnose gastrointestinal tumours (Oakland 1964, Rosenberg 1978, Umpleby 1984). Measuring the rate of exfoliation of tumour cells is more difficult in vivo. Exfoliation occurs from both mucosal and tumour cells, and the debris is incorporated into faecal waste.
The second cause of cell loss is cell death of both single, non viable cells and of large numbers of cells by infarction, by apoptosis and by necrosis, both due to stromal response and to avascularity. Central tumour necrosis is a prominent feature of many colorectal tumours, but the actual contribution of both individual and regional cell death is difficult to quantify. A third possible cause of cell loss is the failure of cell cycle progression by labelled cells. It is possible that a proportion of the labelled population, particularly aneuploid cells, does not proceed to normal mitosis, because of grossly abnormal DNA content.
The contribution of exfoliation to the discrepancy between Vd and Tpot, the cell loss factor, may be estimated in several ways. Clinical models which eliminate exfoliation include the subcutaneous metastases from colo-rectal tumours, invasive breast carcinoma and metastatic malignant melanoma. Serial measurements of the dimensions of the colorectal metastases studied in this series were not available. Secondly, in animal models both the volume growth rate and the Tpot (at sacrifice) can be measured. A colorectal tumour explant grown subcutaneously in the nude mouse is such a model.
Intra-tumour heterogeneity, both of mitotic activity (Aherne 1977) and of ploidy (Petersen 1978) is reported to be a feature of colorectal tumour growth. Tumour biopsies may not be representative of the whole tumour. Tumour heterogeneity in vivo has been studied in this series by measuring multiple specimens from both the periphery and the centre of a large number of specimens. The DNA index is likely to be the best indicator of clonality from the data measured. Wide intratumour variation may reflect the presence of multiple cell lines (clones) with differing proliferative characteristics. In the stem cell theory of tumour growth, proliferating stem cells give rise to non-proliferative end cells by clonal expansion. A monoclonal tumour would be expected to be less heterogenous than a polyclonal tumour both in terms of its DNA content and its proliferative characteristics. Stem cells cannot be identified in situ or by flow cytometry. There is conflicting evidence for the clonogenic theory in this series. Most aneuploid tumours showed little interspecimen variation of the DNA index, but in a few tumours ploidy varied widely. Clonality may vary between the primary tumour and its metastases (Woodruff 1988). In a small group of five patients both primary and metastatic tumour were studied. In only one of these patients was ploidy variation found, in this case the rectal primary being aneuploid (DNA Index = 1.3) and the liver metastasis being diploid. The sample is too small to draw further conclusions.
The meaning of aneuploidy in the malignant process is unclear. It is postulated that chromosomal deletions may be responsible for malignant change. In none of the tumours in this series has conclusive evidence of hypoploidy been observed. This does not exclude the possibility of balanced deletions or deletions undetectable by flow cytometry, but does imply that in 50% or so of tumours, genetic deletions or translocations are accompanied by the acquisition of abnormally large quantities of DNA. It should be stressed that flow cytometry is insufficiently sensitive to detect quantitative changes in DNA content in only one chromosome, and there will probably be an underestimate of the true aneuploidy incidence in any tumour population.
The DNA profile derived from specimens stored in ethanol is less affected by artifact than the profiles derived from dewaxed, formalin fixed specimens. Failure to obtain an analysable DNA profile was rare, whereas in some series of analyses of archival formalin fixed material, failure rates of up to 40% have been reported (Hedley 1987). A wide intratumour variation in LI and Tpot data has been demonstrated in some specimens, and it is concluded that no attempt should be made to classify colorectal tumours as rapidly or slowly proliferating unless multiple specimens from multiple sites within the tumour have been measured.
The relationship between tumour cell proliferation, DNA aneuploidy and biological aggressiveness is not yet clearly understood. In a review of 11 multivariate studies comparing proliferation kinetics with factors such as sex steroid receptor status, lymph node status and histological grade in patients with breast carcinoma, Tubiana and Courdi (1989) showed that the tumour labelling index or S phase fraction has the best correlation with clinical outcome. This may also be true of colorectal cancer. However, biological aggressiveness also depends on other features independent of proliferation, such as the ability to metastasise. It has been shown that the Labelling index alone is not a sufficient indicator of proliferation, because the Ts also varies within a tumour. By combining the ploidy data, LI and Ts measurements to calculate the Tpot, the value of proliferation measurements as determinants of prognosis may be enhanced.
Differences between the flow cytometric Labelling Index and the histochemical labelling index may be due to the effect of fixation (70% ethanol versus formalin and paraffin embedding) or to loss of DNA containing antigen during nuclear extraction in preparation for flow cytometry. Conversely, BRdU staining of histological sections may include antigen binding to cytoplasmic proteins and nucleic acids, or unrecognised antibody cross-reactivity. This would lead to an overestimation of the immunohistochemical LI. It cannot be assumed that either of the two methods measures the "true" BRdU labelling index, although flow cytometry is less prone to observer error and fatigue, and counts many more labelled nuclei.
2:6. Evaluation of the Tpot in an animal model.
The volume doubling time of human colorectal tumours is difficult to assess, and the rate of exfoliation and cell loss from primary tumours is not measurable. The validity of the Tpot concept was thus assessed indirectly in an animal model. By growing tumour xenografts subcutaneously, exfoliation is eliminated as a source of cell loss. Cell death and focal necrosis still occurs, but by comparing the Tpot to the Vd of the tumour during the exponential growth phase of the tumour, the effect of cell death on late tumour growth, when necrosis increases as blood supply is outgrown, is minimised.
2:6:1. The kinetics of tumour xenografts in mice.
A preliminary series of experiments was undertaken to evaluate the suitability of different tumour xenografts in the nude mouse model for measurement of their in vivo kinetics. Such a model would be useful to study the concept of the potential doubling time as compared with the actual growth rate, and to form the basis for future studies of chemotherapeutic manipulation of in vivo kinetics.
2:6:2. Materials and methods.
Experiment 1.
The LS human colorectal tumour cell line was grown in cell culture. 10 BALB/C nude mice were given subcutaneous injections in the left or right flank of one million tumour cells. The animals were inspected weekly for evidence of tumour growth. After 37 days, three of the mice had developed visible tumours. On the 37th day of incubation, these mice were given an intraperitoneal (i/p) bolus dose of 100 micrograms BRdU 3.75 hours prior to sacrifice. The tumours were excised and were preserved in 70% ethanol. BRdU/FCM analysis was performed on the tumours as previously described, with the exceptions that disaggregation was performed in 0.1 mg/ml pepsin in 0.1 M HCl for 20 minutes, and denaturation in 2M HCl was for eight minutes.
Experiment 2
10 Balb/C Nu Nu mice were injected in the thigh pad with two million MC28 rat sarcoma cells in 0.1ml PBS. One mouse died and tumour failed to develop in another. The remaining eight animals were sacrificed after 17 days and the tumours were excised. Four hours prior to sacrifice each animal was given an intraperitoneal bolus dose of 200 micrograms of BRdU.
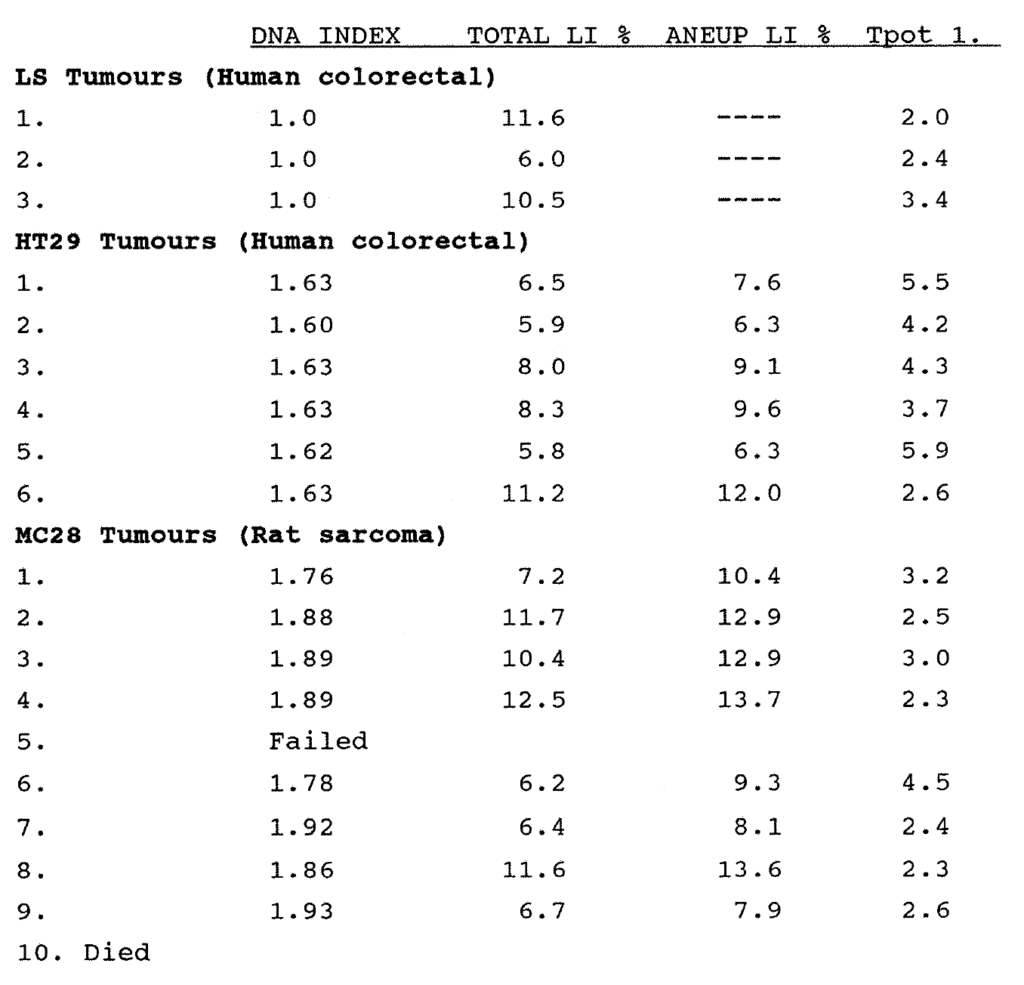
Table 2:6. The cell kinetic data of three tumour xenografts, the LS, HT29 and MC28 tumours grown in nude mice.
Experiment 3
10 Balb/C Nu Nu mice were injected in the thigh pad with two million HT 29 human tumour cells in 0.1ml PBS. Tumour failed to develop in two of 10 animals. The remaining eight animals were sacrificed after 17 days and the tumours were excised. Four hours prior to sacrifice each was given an intraperitoneal bolus dose of 200 micrograms of BRdU.
Experiment 4
Ten adult Nu Nu mice were injected with two million viable MC28 tumour cells as previously described. All ten grew measurable tumours. Tumours were measured in three dimensions with calipers on the 9th, 13th and 16th days following injection. The mean tumour diameter and the tumour volume were calculated from these measurements. This method does introduce errors (see Fiennes 1988). These were considered acceptable for the purposes of this experiment because the ratio of volumes rather than precise volume measurements was required. Animals were sacrificed on the 16th day 4.4 hours after receiving 200 micrograms of BRdU intraperitoneally. Further analysis was as described above. Three tumours produced satisfactory ploidy profiles but failed to label with BRdU. This may have been due to unsatisfactory i/p injection. Subsequent calculations were made on the seven tumours for which satisfactory kinetic data was obtained.
2:6:3. Results
The data for experiments 1-3 are shown in Table 2:6. The results of experiment 4 are shown in Table 2:7. In all tumours the kinetic data were readily obtained, with good quality BRdU labelling and readily analysable histograms. The LS tumour line showed unsatisfactory development in the nude mouse model. Both the rat MC28 and the human HT29 cell lines showed excellent reproducibility of kinetic data from one tumour to another. Although the HT29 cell line was the favoured model for further experiments because it is a human colorectal tumour which grows well in the nude mouse, local difficulties with the stem cultures necessitated the use of the MC28 tumour for further studies.
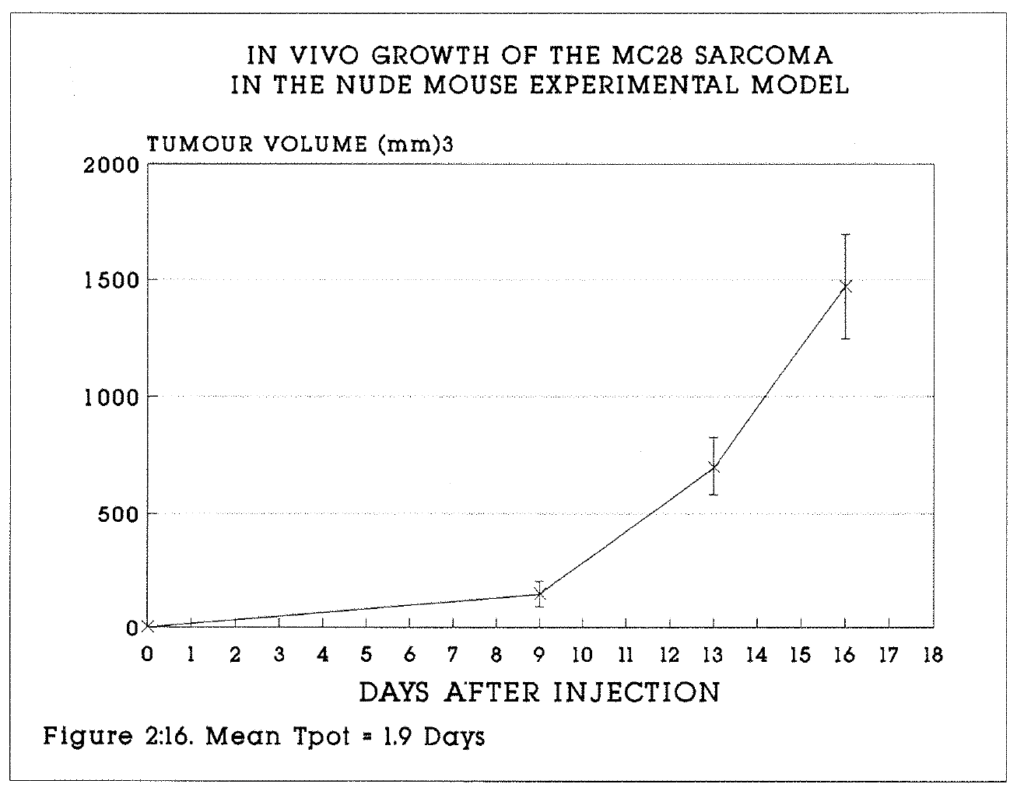
Figure 2:16. The mean tumour volumes (+/- S.E.M.) of the seven analysable tumours are plotted on this graph.
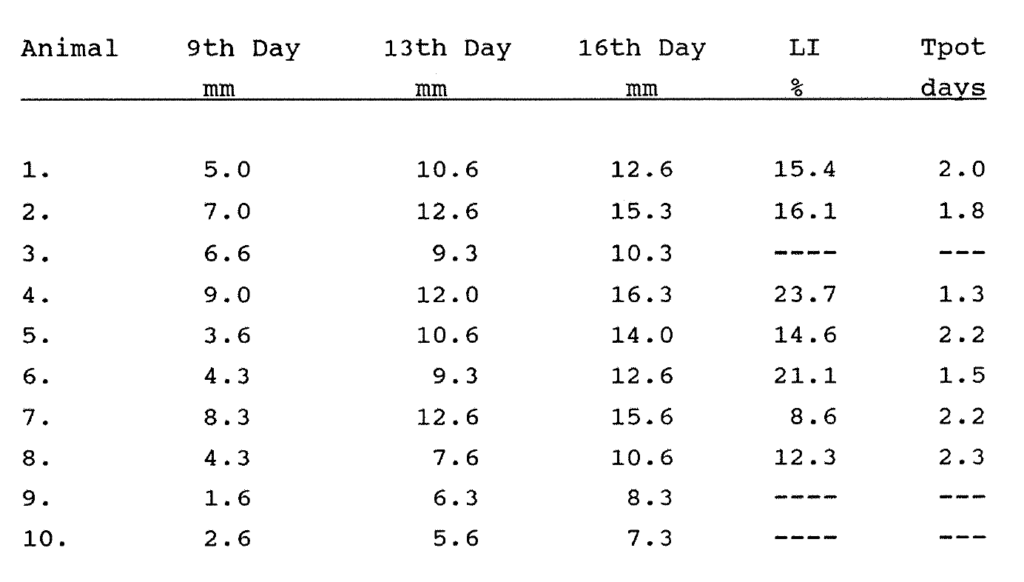
Table 2:7. See text for explanation.
In Table 2:7, the mean tumour diameters are shown at days 9, 13 and 16. The corrected total labelling index and the Tpot are shown. The aneuploid labelling index ranged from 11.9 to 24.1%. The mean Tpot of these tumours on the 16th day was 1.9 days. The Ts ranged from 7.9 to 11.2 hours. The data has been plotted in Figure 2:16 to illustrate the volume growth of the tumour with time. At the time of sacrifice, the tumours had undergone between two and three volume doublings in the preceding three days, during which the tumours were in the exponential phase of cell growth. This is reflected both in the high total and aneuploid BRdU labelling indices of these tumours, and the short Tpot. Exact equivalence between the Tpot and Vd would not be expected, because this would imply a growth fraction of 100% or unity with no cell loss, which is unlikely. From the above data, the growth fraction of these tumours at this stage in growth appears to be of the order of 50%, a plausible percentage within the bounds of experimental error. This experiment provides good evidence to validate the theory and practice of the measurement of the Tpot in vivo. Furthermore, the reproducibility of xenograft tumour cell line kinetic data provides a sound basis for future experiments designed to measure perturbances to cell kinetics induced by drugs, hormones and other treatments.
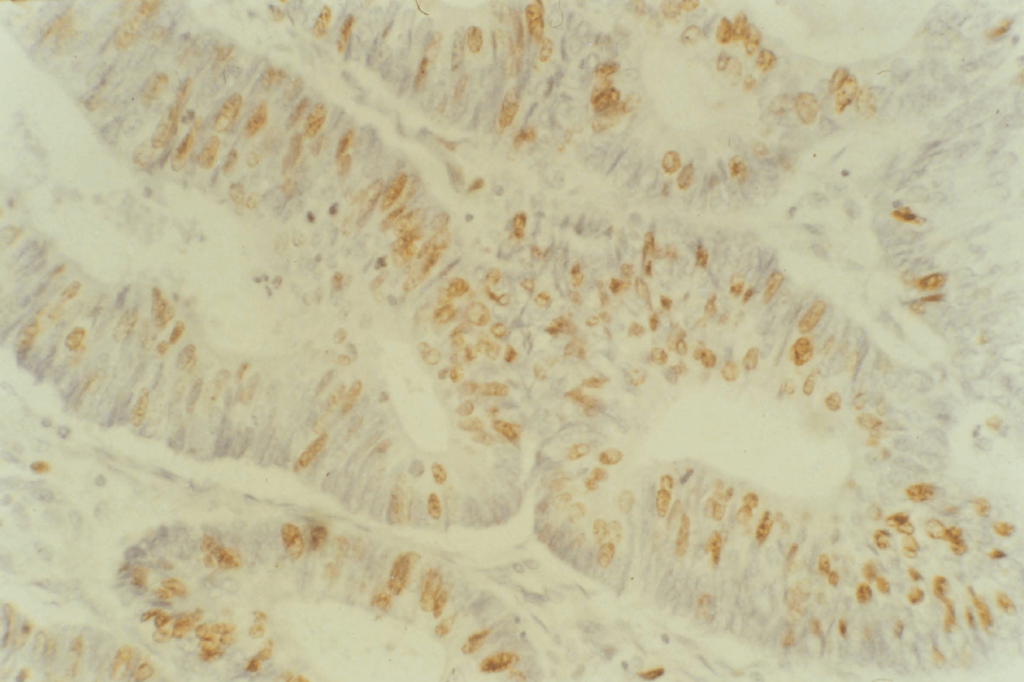
Figure 2:17. A low magnification view of a BRdU labelled, peroxidase stained, moderately differentiated carcinoma of the rectum (RCT022). This tumour was undergoing rapid proliferation. The Tpot was 4.8 days. The stain is clearly seen to be nuclear in distribution.
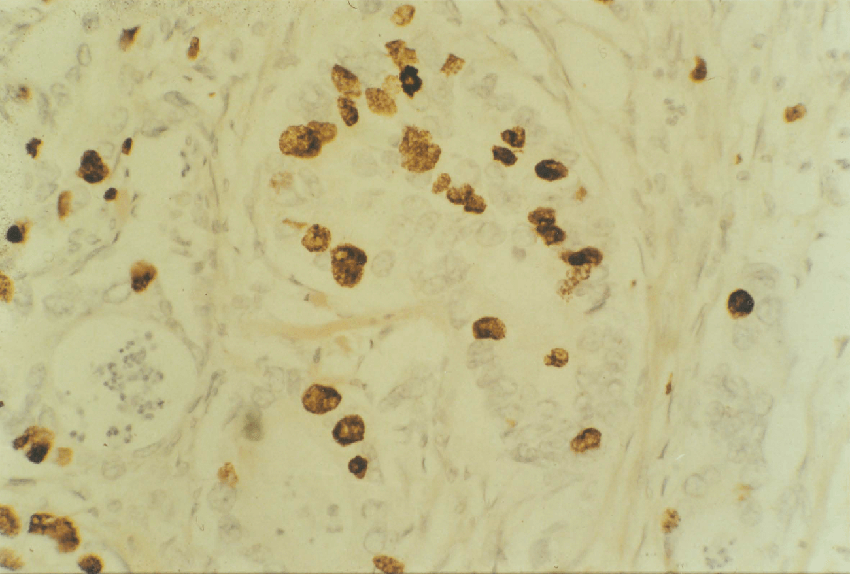
Figure 2:18. A high power view of a moderately differentiated colonic tumour (COLO19). This tumour was also rapidly proliferating (Tpot 5.3 days).
2:6:4. Chapter conclusions.
These are summarised as follows.
- The evaluation of cell kinetic parameters of 100 human primary colorectal cancers and their metastases by flow cytometry and in vivo BRdU labelling has been demonstrated to be safe and reproducible.
- Prospective studies on ploidy using ethanol fixed tissue offer significant improvements in reliable data yield over retrospective analysis of archival tissue.
- A wide range of intra-tumour variation in the Ts, LI and Tpot is observed in colorectal tumours. Variation in the BRdU labelling index makes the greatest contribution to Tpot variation.
- Interpretation of the Ts and Tpot data must be qualified by the limitations of cell cycle theory, the mathematical analysis used and the errors inherent in the methodology. However, a simple in vivo animal model has shown that the Tpot measurements have a valid relationship to the actual tumour doubling time. This allows the interpretations placed upon the in vivo human data to be advanced with some confidence.
- The value of Ts and Tpot data as prognostic and therapeutic indicators for colorectal cancers are as yet unknown. Long term follow up will be undertaken to assess the relationship of the kinetic data to clinical outcome. The use of proliferation data in relation to cytotoxic drug or radiotherapy scheduling will be considered in Chapter 9. There is now an opportunity to study and improve the adjuvant therapy of colorectal cancer in clinical practice based on "real-time" data from individual patients. This is a worthwhile goal.
Appendix 2:A.
The epidemiological and pathological data of the colorectal carcinomas reported in this chapter.
Appendix 2:B.
Kinetic data on the colorectal carcinomas reported in this chapter.
Appendix 2:C.
The BRdU immuno-histochemical staining method.
CHAPTER 3
The proliferation of colorectal mucosa, adenomas and polyposis coli.
3:1. Chapter Abstract.
The in vivo proliferation kinetics of 147 specimens of human gut mucosa from the terminal ileum, colon and rectum, of 10 metaplastic polyps, from two cases of polyposis coli and of four villous adenomas were measured. Specimens were obtained from patients undergoing surgery for colorectal cancer. Kinetic data were obtained by BRdU/FCM.
The ratios of crypt to total (crypt + stromal) mucosal cells were counted at various sites. A crypt labelling index (Crypt LI) was calculated for each mucosal specimen by correcting the flow cytometry data to exclude the stromal cells using this ratio. The Crypt LI ranged from 2.5% in the left colon to 3.7% in the ileum. Using flow cytometric data and the crypt:total correction, the mean crypt cell turnover was calculated to range from 12.0 to 16.6 days in all tissues.
Immunochemically stained mucosal sections were also studied. The labelling index of 50 full length crypts in eight specimens was counted. The crypt labelling index of mucosa 1.0cm and 10.0cm from the primary tumour was compared. There was no significant difference in proliferation with proximity to the tumour. The mucosa of two patients with familial polyposis coli and of two patients without colorectal carcinoma showed no differences in proliferation as compared with mucosa from patients with tumours.
Metaplastic polyps showed the same proliferation as mucosa. Villous adenomas showed a pattern of proliferation intermediate between mucosa and tumours. There was an abrupt change in proliferation patterns at the junction between polyposis coli mucosa and adenomas.
3:2. Introduction
Mucosal kinetic data from the animal and human gastro-intestinal tract has been obtained from studies using tritiated thymidine and vincristine induced metaphase arrest (Camplejohn 1982). The response of these cells to radiotherapy and cytotoxic drugs has also been studied (Wright and Alison 1984). Radioisotope studies yield static proliferation data, principally the Thymidine labelling index of crypt cells, and dynamic data, principally the crypt cell turnover time. In vivo studies of human colorectal mucosal kinetics have been handicapped by the need to use radioisotopes, but much has been learned from in vitro studies.
The use of BRdU for in vitro and in vivo studies of animal mucosal cell kinetics and for in vitro human mucosal cell kinetics by immunohistochemistry has been reported (Wynford Thomas 1986, Chwalinski 1988). The use of BRdU for in vivo studies of human colorectal mucosal cell kinetics by multiparameter flow cytometry has not previously been reported. By combining flow cytometric and histological data in this study, the crypt cell labelling index and the crypt cell turnover time in the ileum, colon and rectum have been calculated.
Colorectal epithelium consists of columnar, mucous and endocrine cells, which migrate from the deep stem cell zone, through the proliferative zone to the surface. These cells are supported by fibroblasts and other stromal cells, which may also undergo slow proliferation. Sunter et al (1978, 1979) showed that the rate of cell proliferation changes along the rat colon, such that it is 25 hours in the caecum and 58 hours in the descending colon. This variation appeared to be due to changes in the duration of G1, other phases remaining constant in duration. Cell cycle time and growth fraction also appear to vary with site in the colonic crypt, such that cells at the bottom of the crypt cycle more slowly. It may be possible to modify mucosal cell kinetics by
endocrine and metabolic means. For example, oestrogen may decrease the incorporation of thymidine in rat mucosa (Sunter 1979).
Normal colonic epithelial cells are believed to migrate from the crypt base over 3-8 days in man (Cole and McKalen, 1961). The reported thymidine labelling index, TLI%, of normal colorectal mucosa varies widely according to methodology (Lipkin 1963, Galand 1968, Bleiberg, 1972, 1977). The characteristics of mucosal kinetics may change with proximity to a tumour (Bleiberg 1977). Cheng et al (1984) used coulter particle counting, flow cytometry, crypt squashes and dried cell preparations to calculate the kinetics of human mucosal biopsies. They calculated the S phase fraction of sigmoid epithelium to be 15.2% +/- 1.9% and of rectal epithelium to be 4.1% +/- 1.9%.
Increased cell proliferative rates are found in the mucosa of patients with ulcerative colitis (Serafini et al, 1981). Blocks of rectal biopsy tissue from 26 patients with the disease were incubated for six hours with 3H-Thy and the proliferation index was calculated. It was proposed that the increased proliferation in both active and quiescent disease may contribute to the development of carcinoma. The pattern of proliferation may change in disease states. The proliferation zone extends throughout the crypt in active colitis (Bleiberg, 1970).
Familial polyposis coli is of particular interest in the study of mucosal kinetics as it is a premalignant state. Bleiberg (1972) confirmed the presence of atypical proliferation zones in colonic mucosa by in vitro labelling of freshly excised polyps and mucosa. The labelling index of mucosa was 10-10.8% and of polyps was 18-28.7%. The Crypt Cell Turnover Time (CCTR) was 74-86 hours in mucosa and 31-32 hours in polyps. Lightdale et al (1982) studied a patient with familial polyposis using 3H-Thy in vivo. Cells in both normal mucosa and premalignant polyps passed through only one
cell cycle in four days, with G2 lasting five hours and S lasting 15 hours. Markedly retrograde cell migration from the tissue surface was also noted in the adenomas but not in normal mucosa.
The mucosa-adenoma-cancer sequence in the human gastrointestinal tract is of considerable interest. Muto et al (1975) have shown that large villous adenomas with severe atypia are most likely to progress to invasive malignancy, but that the process is slow and the mechanism is unknown. An increased tendency to aneuploidy and to altered proliferation has been shown as malignant change develops (Giaretti, Sciallero 1988). The relationship between mucosal and tumour cell proliferation, and its role in tumour development is uncertain. Lipkin (1971) studied cell cycle times by the Fraction of Labelled Mitoses technique. The Tc was 24-48 hours, the S phase duration was 10-20 hours and the G2 duration was less than eight hours in both tumour and mucosa cells. Camplejohn (1982) studied 19 patients with tumours undergoing surgery. 11 normal mucosa specimens were also obtained. He reported that the cell generation time of colonic tumour cells was 3-7 days and one day in normal mucosal cells. He calculated that the cell cycle time was 190 hours in tumour cells but was 85 hours in normal mucosa. A stathmokinetic technique with Vincristine induced metaphase arrest was used. Bleiberg (1976) used thymidine labelling to demonstrate a higher labelling index and longer S phase in colorectal tumours (32.5% and 19.4 hours) than in adjacent mucosa (17.0% and 11.2 hours).
Terpestra et al (1987) used in vitro thymidine labelling of mucosa from patients with and without malignancy. There was a higher labelling index (mean 8.6% versus 6.2%) in mucosa from patients with cancer. Meyer (1981) showed no relationship in 90 tumours between the Labelling Index and tumour pathology or prognosis by thymidine labelling.
Risio (1988) reported that the labelling index of normal mucosa and metaplastic polyps labelled in vitro with BRdU was significantly lower than in dysplastic adenomas and carcinomas, and was confined to the lower two thirds of crypts. Khan et al (1988) infused BRdU into 14 patients with metastatic colonic adenocarcinoma. Biopsies of tumour and normal mucosa were excised two hours later. Labelling was of good quality and highly specific. The mean labelling index of tumour was 24% (range 15.0-40.6%) and of mucosa was 11% (range 3.6-20.0%). This data is summarised in Table 3:1.
2:6:4. Chapter conclusions.
These are summarised as follows.
- The evaluation of cell kinetic parameters of 100 human primary colorectal cancers and their metastases by flow cytometry and in vivo BRdU labelling has been demonstrated to be safe and reproducible.
- Prospective studies on ploidy using ethanol fixed tissue offer significant improvements in reliable data yield over retrospective analysis of archival tissue.
- A wide range of intra-tumour variation in the Ts, LI and Tpot is observed in colorectal tumours. Variation in the BRdU labelling index makes the greatest contribution to Tpot variation.
- Interpretation of the Ts and Tpot data must be qualified by the limitations of cell cycle theory, the mathematical analysis used and the errors inherent in the methodology. However, a simple in vivo animal model has shown that the Tpot measurements have a valid relationship to the actual tumour doubling time. This allows the interpretations placed upon the in vivo human data to be advanced with some confidence.
- The value of Ts and Tpot data as prognostic and therapeutic indicators for colorectal cancers are as yet unknown. Long term follow up will be undertaken to assess the relationship of the kinetic data to clinical outcome. The use of proliferation data in relation to cytotoxic drug or radiotherapy scheduling will be considered in Chapter 9. There is now an opportunity to study and improve the adjuvant therapy of colorectal cancer in clinical practice based on "real-time" data from individual patients. This is a worthwhile goal.
Appendix 2:A.
The epidemiological and pathological data of the colorectal carcinomas reported in this chapter.
Appendix 2:B.
Kinetic data on the colorectal carcinomas reported in this chapter.
Appendix 2:C.
The BRdU immuno-histochemical staining method.
CHAPTER 3
The proliferation of colorectal mucosa, adenomas and polyposis coli.
3:1. Chapter Abstract.
The in vivo proliferation kinetics of 147 specimens of human gut mucosa from the terminal ileum, colon and rectum, of 10 metaplastic polyps, from two cases of polyposis coli and of four villous adenomas were measured. Specimens were obtained from patients undergoing surgery for colorectal cancer. Kinetic data were obtained by BRdU/FCM.
The ratios of crypt to total (crypt + stromal) mucosal cells were counted at various sites. A crypt labelling index (Crypt LI) was calculated for each mucosal specimen by correcting the flow cytometry data to exclude the stromal cells using this ratio. The Crypt LI ranged from 2.5% in the left colon to 3.7% in the ileum. Using flow cytometric data and the crypt:total correction, the mean crypt cell turnover was calculated to range from 12.0 to 16.6 days in all tissues.
Immunochemically stained mucosal sections were also studied. The labelling index of 50 full length crypts in eight specimens was counted. The crypt labelling index of mucosa 1.0cm and 10.0cm from the primary tumour was compared. There was no significant difference in proliferation with proximity to the tumour. The mucosa of two patients with familial polyposis coli and of two patients without colorectal carcinoma showed no differences in proliferation as compared with mucosa from patients with tumours.
Metaplastic polyps showed the same proliferation as mucosa. Villous adenomas showed a pattern of proliferation intermediate between mucosa and tumours. There was an abrupt change in proliferation patterns at the junction between polyposis coli mucosa and adenomas.
3:2. Introduction
Mucosal kinetic data from the animal and human gastro-intestinal tract has been obtained from studies using tritiated thymidine and vincristine induced metaphase arrest (Camplejohn 1982). The response of these cells to radiotherapy and cytotoxic drugs has also been studied (Wright and Alison 1984). Radioisotope studies yield static proliferation data, principally the Thymidine labelling index of crypt cells, and dynamic data, principally the crypt cell turnover time. In vivo studies of human colorectal mucosal kinetics have been handicapped by the need to use radioisotopes, but much has been learned from in vitro studies.
The use of BRdU for in vitro and in vivo studies of animal mucosal cell kinetics and for in vitro human mucosal cell kinetics by immunohistochemistry has been reported (Wynford Thomas 1986, Chwalinski 1988). The use of BRdU for in vivo studies of human colorectal mucosal cell kinetics by multiparameter flow cytometry has not previously been reported. By combining flow cytometric and histological data in this study, the crypt cell labelling index and the crypt cell turnover time in the ileum, colon and rectum have been calculated.
Colorectal epithelium consists of columnar, mucous and endocrine cells, which migrate from the deep stem cell zone, through the proliferative zone to the surface. These cells are supported by fibroblasts and other stromal cells, which may also undergo slow proliferation. Sunter et al (1978, 1979) showed that the rate of cell proliferation changes along the rat colon, such that it is 25 hours in the caecum and 58 hours in the descending colon. This variation appeared to be due to changes in the duration of G1, other phases remaining constant in duration. Cell cycle time and growth fraction also appear to vary with site in the colonic crypt, such that cells at the bottom of the crypt cycle more slowly. It may be possible to modify mucosal cell kinetics by
endocrine and metabolic means. For example, oestrogen may decrease the incorporation of thymidine in rat mucosa (Sunter 1979).
Normal colonic epithelial cells are believed to migrate from the crypt base over 3-8 days in man (Cole and McKalen, 1961). The reported thymidine labelling index, TLI%, of normal colorectal mucosa varies widely according to methodology (Lipkin 1963, Galand 1968, Bleiberg, 1972, 1977). The characteristics of mucosal kinetics may change with proximity to a tumour (Bleiberg 1977). Cheng et al (1984) used coulter particle counting, flow cytometry, crypt squashes and dried cell preparations to calculate the kinetics of human mucosal biopsies. They calculated the S phase fraction of sigmoid epithelium to be 15.2% +/- 1.9% and of rectal epithelium to be 4.1% +/- 1.9%.
Increased cell proliferative rates are found in the mucosa of patients with ulcerative colitis (Serafini et al, 1981). Blocks of rectal biopsy tissue from 26 patients with the disease were incubated for six hours with 3H-Thy and the proliferation index was calculated. It was proposed that the increased proliferation in both active and quiescent disease may contribute to the development of carcinoma. The pattern of proliferation may change in disease states. The proliferation zone extends throughout the crypt in active colitis (Bleiberg, 1970).
Familial polyposis coli is of particular interest in the study of mucosal kinetics as it is a premalignant state. Bleiberg (1972) confirmed the presence of atypical proliferation zones in colonic mucosa by in vitro labelling of freshly excised polyps and mucosa. The labelling index of mucosa was 10-10.8% and of polyps was 18-28.7%. The Crypt Cell Turnover Time (CCTR) was 74-86 hours in mucosa and 31-32 hours in polyps. Lightdale et al (1982) studied a patient with familial polyposis using 3H-Thy in vivo. Cells in both normal mucosa and premalignant polyps passed through only one cell cycle in four days, with G2 lasting five hours and S lasting 15 hours. Markedly retrograde cell migration from the tissue surface was also noted in the adenomas but not in normal mucosa.
The mucosa-adenoma-cancer sequence in the human gastrointestinal tract is of considerable interest. Muto et al (1975) have shown that large villous adenomas with severe atypia are most likely to progress to invasive malignancy, but that the process is slow and the mechanism is unknown. An increased tendency to aneuploidy and to altered proliferation has been shown as malignant change develops (Giaretti, Sciallero 1988). The relationship between mucosal and tumour cell proliferation, and its role in tumour development is uncertain. Lipkin (1971) studied cell cycle times by the Fraction of Labelled Mitoses technique. The Tc was 24-48 hours, the S phase duration was 10-20 hours and the G2 duration was less than eight hours in both tumour and mucosa cells. Camplejohn (1982) studied 19 patients with tumours undergoing surgery. 11 normal mucosa specimens were also obtained. He reported that the cell generation time of colonic tumour cells was 3-7 days and one day in normal mucosal cells. He calculated that the cell cycle time was 190 hours in tumour cells but was 85 hours in normal mucosa. A stathmokinetic technique with Vincristine induced metaphase arrest was used. Bleiberg (1976) used thymidine labelling to demonstrate a higher labelling index and longer S phase in colorectal tumours (32.5% and 19.4 hours) than in adjacent mucosa (17.0% and 11.2 hours).
Terpestra et al (1987) used in vitro thymidine labelling of mucosa from patients with and without malignancy. There was a higher labelling index (mean 8.6% versus 6.2%) in mucosa from patients with cancer. Meyer (1981) showed no relationship in 90 tumours between the Labelling Index and tumour pathology or prognosis by thymidine labelling.
Risio (1988) reported that the labelling index of normal mucosa and metaplastic polyps labelled in vitro with BRdU was significantly lower than in dysplastic adenomas and carcinomas, and was confined to the lower two thirds of crypts. Khan et al (1988) infused BRdU into 14 patients with metastatic colonic adenocarcinoma. Biopsies of tumour and normal mucosa were excised two hours later. Labelling was of good quality and highly specific. The mean labelling index of tumour was 24% (range 15.0-40.6%) and of mucosa was 11% (range 3.6-20.0%). This data is summarised in Table 3:1.
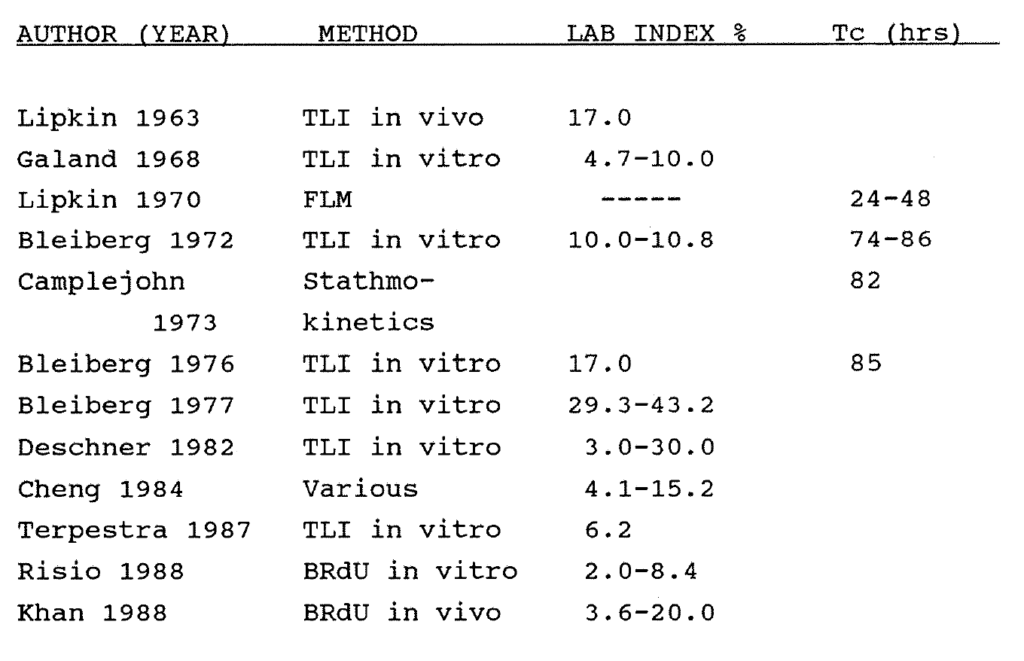
Table 3:1. Published data on the labelling index and cell cycle times of human colorectal mucosa. Most studies have been performed in vitro using thymidine labelling (TLI). FLM = Fraction of labeled mitoses. Tc = Cell Cycle Time.
3:3:1. Methods.
Strips of mucosa measuring 3.0 x 1.0cm were dissected with scissors from the submucosa and stored in 70% ethanol at minus 4°C. Tissue disaggregation was by mechanical dissection followed by incubation of the fragments in 8mls porcine pepsin (Sigma) solution in 0.1M HCl at a concentration of
The resulting suspension of nuclei and cellular fragments was filtered through a 35 micron mesh and centrifuged at 1500 rpm for five minutes. The BRdU content of stored mucosal and polyp specimens is stable when they are preserved in 70% Ethanol or methylated 70% Ethanol and kept refrigerated at minus 4°C. Specimens have been successfully rerun 12 months following surgery with comparable results. The analyses were performed on the same machine and using the same methods as described in Chapter 2. Data for 10-15,000 nuclei were collected from each specimen.
Flow cytometric analysis does not distinguish the crypt cells from the stromal cells, which are mostly non-proliferating. The total number of crypt and stromal cells is given by the FCM data. The ratio of crypt cells to total (crypt + stromal) cells (F), the crypt cell fraction, was calculated by field counting of standard five micron tissue sections under a light microscope. The proportion of crypt to total cells varies along the gastrointestinal tract. 483 random fields of ileal, colonic and rectal mucosa (93,500 cells) were counted manually, yielding values of the crypt to total cell ratio of:
Ileum - 0.55
Colon - 0.59
Rectum - 0.73
A flow diagram of the analyses performed is given in Figure 3:1. Using these ratios, the BRdU labelling index and the Tpot of the whole specimen which are given by flow cytometry can be converted to values which apply to the crypt nuclei only. The BRdU labelling index within crypts (Crypt LI) at any site is thus higher than the total (FCM) labelling index by a factor of 1/F

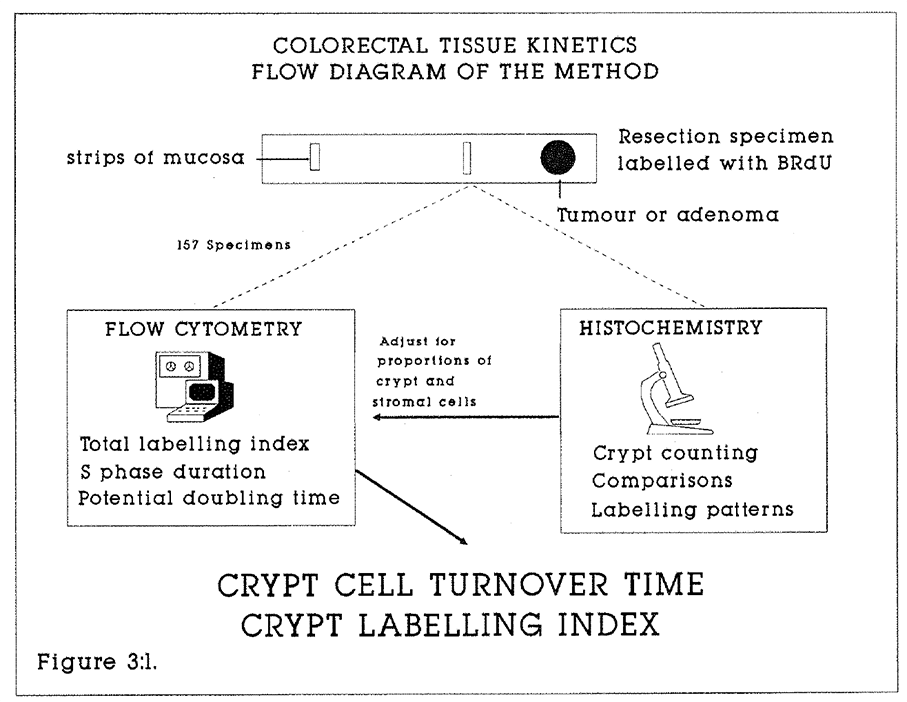
Figure 3:1. This flow diagram illustrates the sequence of procedures which were used to calculate the mucosal proliferation data.
This is a broad approximation, because other factors such as lymphoid aggregates will distort the data. A small but variable fraction of stromal cells label with BRdU. There will thus be an overcalculation of the true crypt labelling index using flow cytometric data. These calculations were not applied to the polyps and adenomas, for which uncorrected FCM data is described.
3:3:2. Crypt cell turnover time (CCTR).
Unlike tumours, normal mucosal growth is a steady state. Cell gain by proliferation equals cell loss by exfoliation. The time taken for 100% of cells to be replaced in the crypt equals the potential doubling time of the crypt. Because the FCM data applies to the whole tissue, the apparent doubling time of the mucosa will be greater than the actual crypt turnover rate by a factor reflecting the proportion of stromal nuclei in the cytometric assay. A simple correction can therefore be made to convert the machine-measured Tpot to an approximation of the crypt cell turnover time (CCTR). The spatial orientation of proliferating cells in intact mucosa does not affect this calculation.
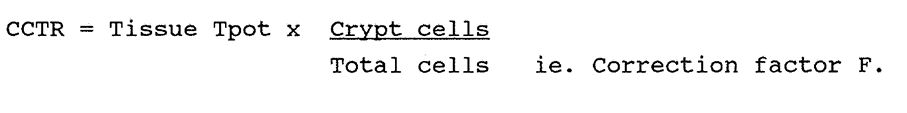
3:3:3. Immunohistochemical localisation of BrdU.
Avidin-biotin peroxidase immunohistochemical staining of 60 BrdU labelled mucosal and adenoma sections was performed as described in Appendix 2:C. Examples are shown. These yielded substantial additional information to the FCM data.
- In order to test the hypothesis that there may be detectable changes in proliferative activity in mucosa adjacent to primary adenocarcinomas, pairs of mucosal sections were taken 1cm and 10cm from primary tumours (10 colonic, 13 rectal) and stained. They were compared with sections of labelled right colon mucosa from two patients with non malignant disease. Counting was confined to standard fields in the proliferation zones of crypts in these sections, as illustrated in Figure 3:2.
- To validate the FCM data, the BrdU labelling indices of 50 full length (longitudinally sectioned) crypts in eight sections were counted.
- The pattern of staining and proliferation was compared between polyposis coli mucosa and normal specimens.
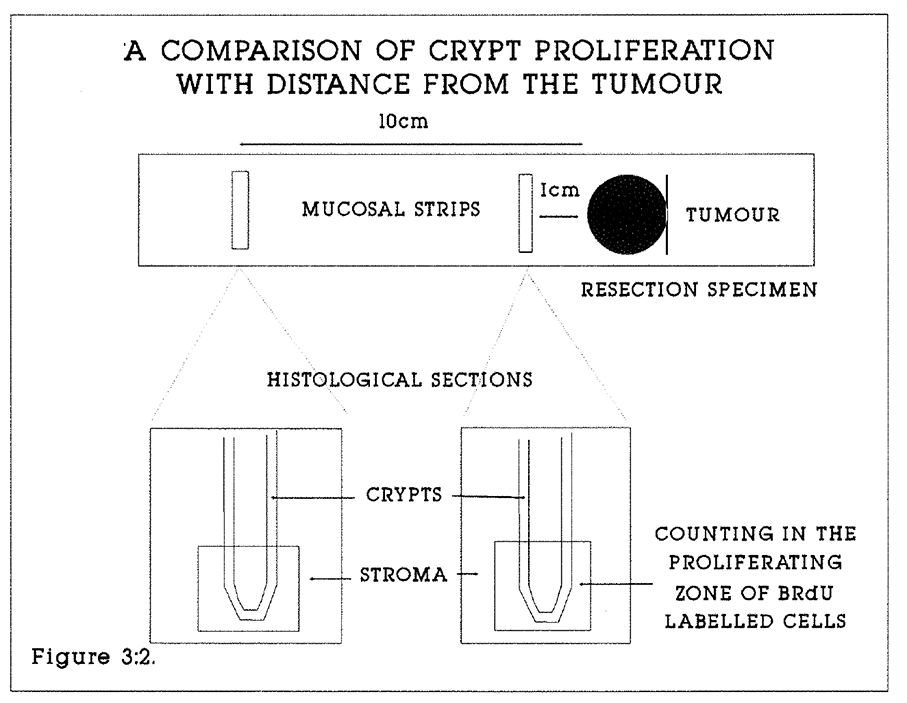
Figure 3:2. This diagram illustrates the method by which the proliferation of mucosal crypts 1.0cm and 10cm from the primary tumour were compared.
3:4:1. Results.
157 mucosal specimens for flow cytometry were obtained from 85 patients undergoing colonic or rectal resections for adenocarcinoma as described in Chapter 2. Four mucosal specimens were obtained from two patients with inflammatory colonic masses and 11 specimens from two patients with severe polyposis coli. The principles governing selection of specimens were that mucosa was macroscopically normal, and that mucosal specimens for flow cytometry were at least 2.0cm from a primary tumour to reduce the risk of tumour infiltration of the specimen. 14 other specimens failed to yield data suitable for analysis.
3:4:2. Flow cytometry data.
The mean flow cytometric labelling index of 157 ileo-colo-rectal specimens was 2.0% (range 0.6-8.4%, median 1.7%). The mean S phase duration was 10.7 hours, (range 3.1-37.5 hours, median 9.7 hours). The mean potential doubling time was 24.8 days, (range 2.9-101.5 days, median 20.1 days). The cytometric data from specimens in each “anatomical" subdivision were pooled. Data were corrected for crypt to total cell ratio as described in the methods section. The results of these calculations and the number of specimens from each site are shown in Table 3:2. Median total crypt labelling indices and total crypt cell turnover times were calculated.
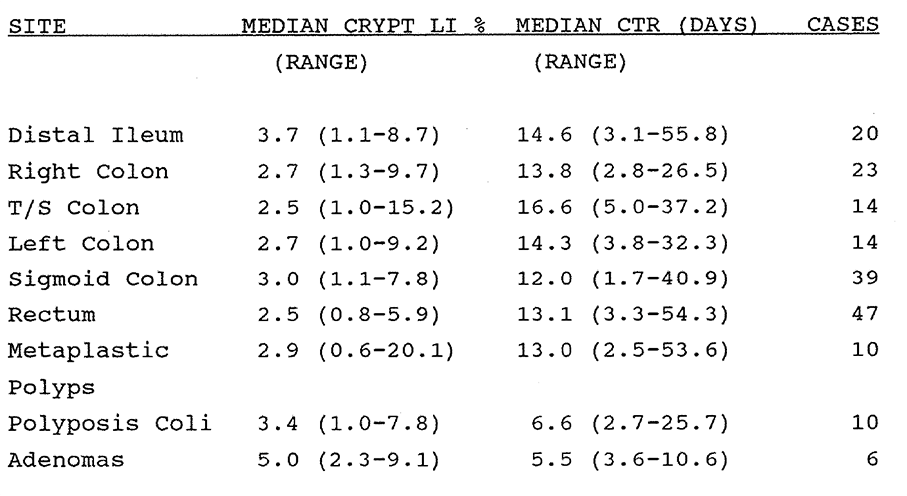
Table 3:2. The Median values of the crypt labelling index and the estimated crypt turnover time are shown. Labelling index and Tpot data derived by flow cytometry has been corrected by the factors described in the text to account for the ratio of crypt to total mucosal cells in the flow specimens.
The data show that there was no significant variation in the median calculated total crypt labelling index or the median cell turnover time from region to region along the colon and rectum. There was a broad interspecimen variation in the results which may reflect both a true variation and also the range of experimental error in the methodology.
The mean crypt labelling index of 11 specimens of colonic mucosa taken at surgery from sites throughout the colon of the two patients with polyposis coli was 4.2% (range 1.0-7.8%, median 3.4%). The mean crypt cell turnover time was 8.1 days (range 2.7-25.7 days, median 6.6 days). There was a trend to more rapid proliferation than was observed in normal colorectal mucosa, but the numbers of specimens were too small to substantiate this observation.
Six specimens also were analysed from four villous adenomas. The mean total labelling index of all specimens was 5.3% (range 2.3-9.1%, median 5.0%). The mean potential doubling time was 6.2 days (range 3.6-10.6 days, median 5.5 days). The crypt correction calculation was not applied to these lesions. There was a significant difference (Mann Whitney and Student t-tests, p = 0.01) when the data was compared with normal mucosa.
3:4:3. Immunohistochemical data.
The immunohistochemical pattern of staining was assessed within normal mucosal crypts, villous adenomas and in the mucosa of two patients with polyposis coli. All staining was confined to the deepest or stem cell zone of colonic and rectal mucosal crypts. Within the proliferation zone the mean labelling index was 31.1% (range 11.5-72.0%) in colonic crypts (120 fields counted in 12 sections) and was 23.2% (range 7.7-51.3%) in rectal mucosa (125 fields from 13 sections). Staining was clean, precise and reproducible. Staining was observed in pericryptal stroma in small numbers of cells, and particularly in lymphocytes within the lymphatic follicles. The pattern of staining in villous adenomas was in marked contrast to that of normal mucosa. Proliferation was seen throughout the villous crypts, and was particularly prominent at the tips of the crypts, even in small polyps. The change in this pattern at the junction of the crypt and normal mucosa was quite abrupt (Figure 3:6).
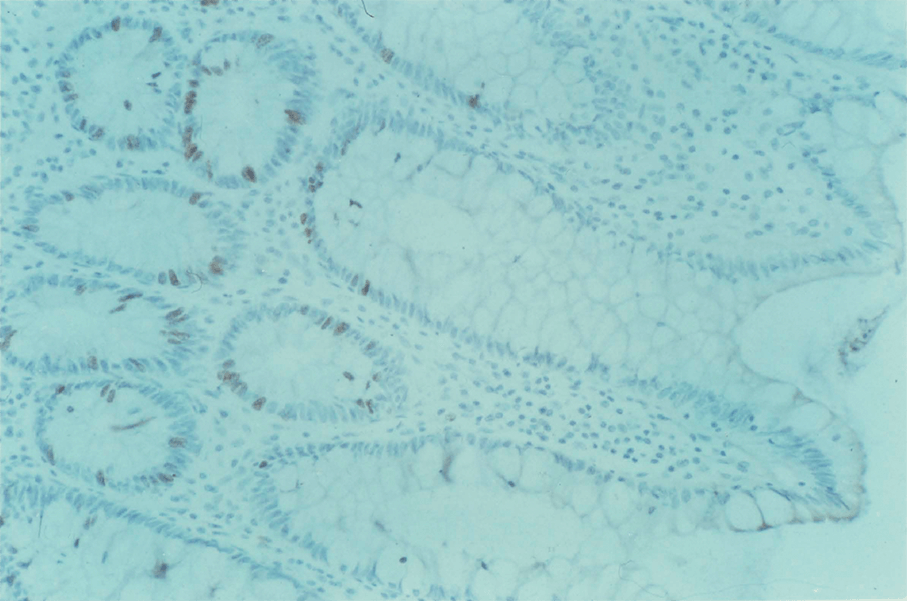
Figure 3:3. Photomicrograph of 5 micron section of colonic mucosa from a patient with a carcinoma of the rectum; S phase cells labelled with BRdU are stained brown by the avidin-biotin peroxidase technique. Magnification x 25.
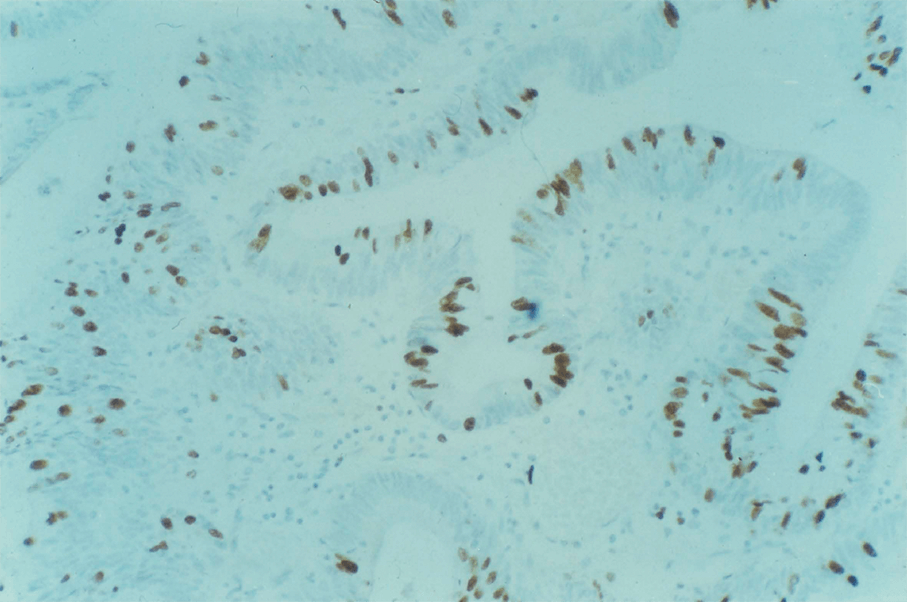
Figure 3:4. Photomicrograph of 5 micron section of a villous adenoma of the rectum; S phase cells labelled with BRdU are stained brown. Magnification x 25.
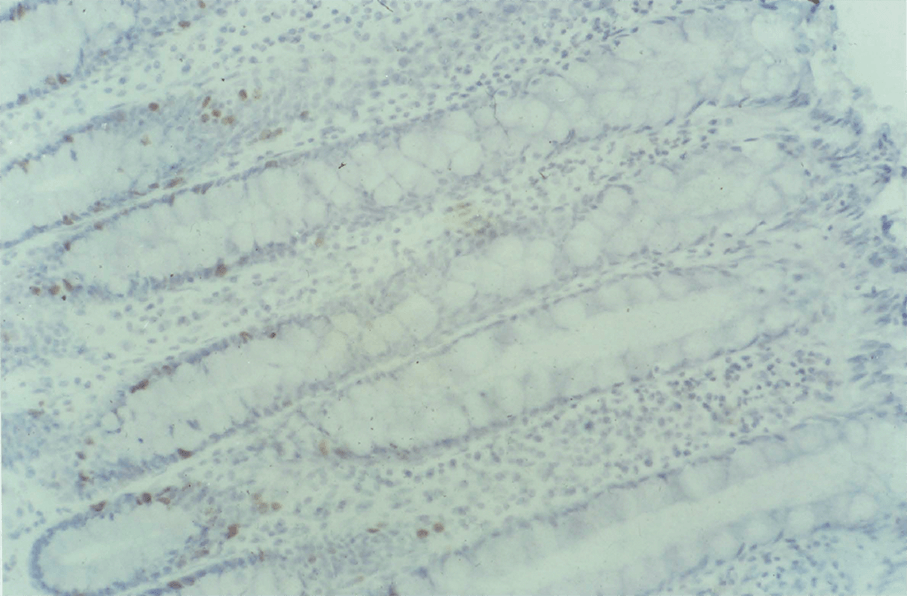
Figure 3:5. BRdU labelled colonic mucosa from a patient with polyposis coli.
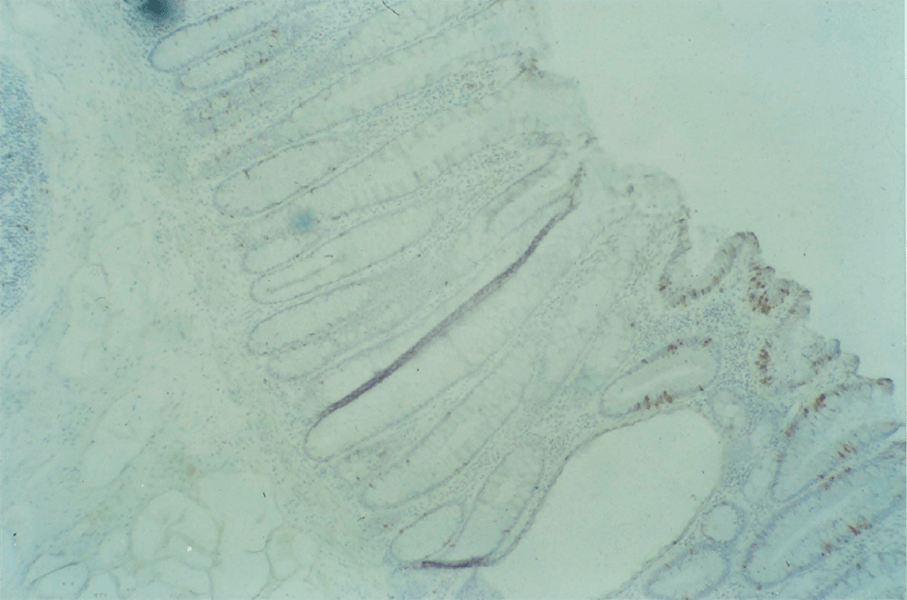
Figure 3:6. BRdU labelled colonic mucosa from a patient with polyposis coli at the transition zone between "normal" mucosa and a small polyp. The change in the staining pattern at the boundary is shown dramatically.
The pattern of staining in non-polypoid colorectal mucosa from patients with polyposis coli showed no discernible differences from mucosa from patients with malignant or non-malignant disease. The change from "normal" mucosa to polyps was abrupt.
3:4:4. Features of mucosa 1cm and 10cm from primary tumour.
Primary staining was confined to the stem cell zone. No differences were discernible between the proliferative patterns in the 23 pairs of mucosal sections from patients with malignancy or the sections from patients without colorectal tumours. The labelling indices within the stem cell zones were counted and compared (Figure 3:2). In mucosa 1.0cm from the tumour, the mean labelling index in the stem cell zone (in 255 fields from 23 sections) was 20.9%, range 3.8-51.7%. In mucosa 10cm from the tumour, the mean labelling index in the stem cell zone (in 260 fields from 23 sections) was 26.9%, range 7.7-72.4%. In mucosa from the non malignant, normal colons, the mean labelling index in the stem cell zone (in 40 fields from four sections) was 29.7%, range 14.2-47.5%. The proportion of proliferating cells in the stem cell zone did not change with proximity to the tumour. This suggests that local changes in mucosal proliferation do not occur in association with colorectal malignancy.
3:4:5. Crypt labelling indices by counting.
Eight mucosal sections were selected in which numbers of representative crypts had been cut in longitudinal section. All mucosal cells and all BRdU labelled cells in 50 such crypts were counted. No correction was made for the three-dimensional structure of the crypts (see Wright and Alison, 1984). The results are shown in Table 3:3, with FCM data for the nearest equivalent mucosal specimen from the same patient also given. This is a not a detailed comparison, because of non random crypt sampling, possible counting errors and because closely adjacent specimens are not being compared by FCM and histochemistry. The very wide discrepancy in one case is unexplained. This data suggests that FCM measurement of mucosal labelling indices and crypt proliferation may be a practical adjunct to conventional methods of studying crypt proliferation.
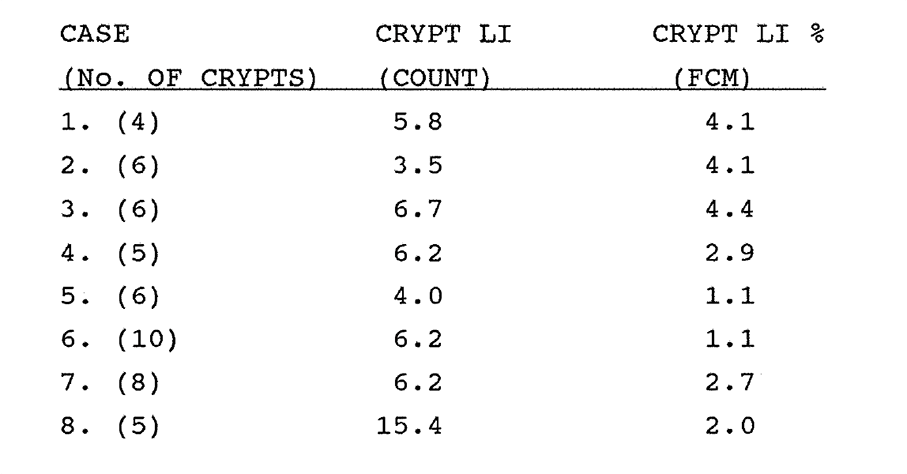
Table 3:3. See text.
3:5. Discussion.
The techniques described in this chapter are a new approach to the in vivo measurement of colorectal tissue proliferation kinetics. Disaggregation of mucosa and polyps into constituent nuclei was satisfactory in the conditions described in Chapter 2. A few specimens showed excessive digestion and disruption of the DNA profile. It is assumed that pepsin digestion separates epithelial and stromal cells equally, so that the nuclear suspension contains representative fractions of nuclei from all cell types. It is not possible to confirm this by microscopy after digestion. Labelling of non- epithelial cells with BrdU, particularly lymphocytes in gut lymphoid follicles can be demonstrated. It is not possible to distinguish epithelial from stromal nuclei in the diploid histogram. These cells will tend to produce a high estimate of crypt labelling.
In vivo labelling of mucosa with BrdU may have advantages over in vitro studies. For example, it is more physiological and less disruptive than diffusion labelling of excised tissue fragments. However, published mucosal labelling index data obtained by other methods appear to be broadly comparable with those obtained by in vivo labelling with BrdU in this series, as shown in Tables 3:1 and 3:2. The particular advantage of in vivo labelling with BrdU, as is the case with tumour kinetics, is the facility to calculate the Ts and the Tpot, and hence the crypt turnover rate without using radioisotopes.
Crypt cell kinetics do not appear to change with anatomical site in the colon and rectum. Both the estimated median crypt labelling indices and the crypt turnover rates are remarkably constant (Table 3:2, Figure 3:7.), although there is a wide interspecimen variation in the crypt labelling index and the crypt cell turnover rate. Most measurements were performed on mucosa from patients with malignant disease. It may be that such mucosa is different to that of "normal" mucosa from unaffected patients. There were no detectable abnormalities in the samples studied. It is possible that molecular differences exist in "premalignant" mucosa, but these have not been detected in this study. In particular, there was no difference in the kinetics of mucosa taken from two patients given BrdU on the radiological evidence of colonic carcinoma and subsequently found to have non-malignant disease, and from patients with malignancy. There was no difference in proliferation zone labelling or histology of mucosa 1.0cm and 10cm away from the tumour. This suggests that a gradient of proliferative change from normal mucosa to tumour does not occur. Changes in mucosal proliferation are unlikely to be the immediate cause of colorectal cancer (Lipkin and Higgins, 1988, Tubiana and Courdi, 1989), although an increase in proliferative activity through the mucosa-adenoma-cancer sequence has been shown. However, in vivo measurement of mucosal cell proliferation kinetics may lead to a better understanding of the physiology of diseased states such as ulcerative colitis, of the behaviour of tumour cells and of the response of mucosa to radiotherapy and to cytotoxic drugs.
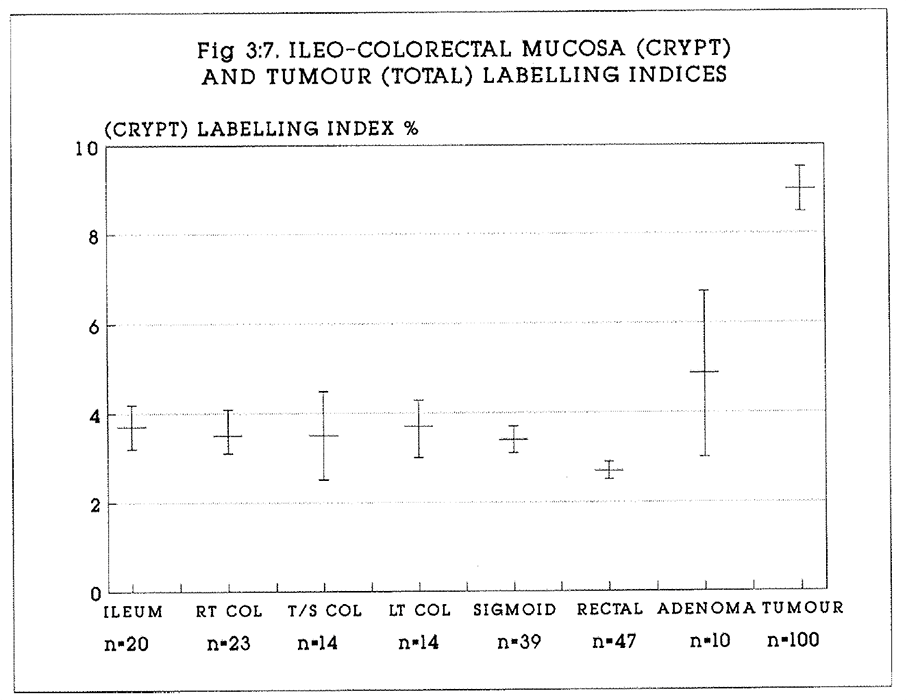
Figure 3:7. Summarises the crypt labelling data. The mean values of the crypt labelling indices (+/- S.E.M.) are shown for each region of mucosa. The total labelling indices of villous adenomas and carcinomas are shown for comparison.
The relationship between the controls to proliferation of colonic mucosa and colorectal tumours remains unknown. The new technique described in this chapter offers practical advantages to studies of in vivo proliferation, both in animal and human studies where the ethical conditions for the in vivo use of BrdU are appropriate.
Appendix 3:A.
Flow cytometric data for the specimens described in this chapter.
CHAPTER 4
The proliferation of gastro-oesophageal carcinomas and mucosa.
4:1:1. Squamous carcinoma of the oesophagus.
4,000 deaths are caused annually in the UK by oesophageal squamous carcinomas. Prognosis is uniformly poor with a five year life expectancy of 5% or less. The aetiology is uncertain, although chronic iron deficiency anaemia, corrosive damage and achalasia are recognised premalignant conditions. Spread is by direct extension, lymphatic and haematogenous metastasis. Surgery offers the best chance of a cure. Earlam (1980) reviewed 122 surgical series from the world literature to report a 4% five year survival, and a 29% early postoperative mortality. Radiotherapy used palliatively, pre- or postoperatively has little effect on survival in most series. No clear clinical grading system has emerged as a guide to prognosis. Histological features of the tumour which have been studied include tumour differentiation, depth of infiltration, glandular and small cell differentiation, lymphatic and vascular spread and host inflammatory response. A better understanding of the tumour kinetics may lead to better treatment for this disease and to better prognostic indicators.
Lampe (1987) described FCM analysis of five laryngeal, seven lingual, and five other oropharyngeal tumours. Their numbers and follow up were too limited for useful conclusions to be drawn. Teodori et al (1986) reported the ploidy of six squamous oesophageal tumours, in which the DNA index ranged from 1.10-1.94. Edwards (1989) studied retrospectively the relationship of tumour ploidy to prognosis of 100 oesophageal tumours from patients undergoing resections. DNA aneuploidy was associated with tumour necrosis, fibrosis and with a better prognosis than diploidy. No other histological features of the tumour correlated with ploidy.
4:1:2. Oesophageal squamous mucosa.
Proliferation occurs in a single layer of cells in the basal stratum. Renewal of the epithelium is believed to take 30 days in man (Lipkin 1971). Little is known about the controls of proliferation or about the relationship between squamous mucosal growth and malignant transformation.
4:1:3. Gastro-oesophageal adenocarcinoma.
No clear clinical grading has emerged as a guide to prognosis of these tumours. In the United Kingdom the five year survival is less than 5% (Fielding 1980). There is a wide geographic variation in incidence. It is more common in the Far East than in Western Europe. Early diagnosis is unusual except where endoscopic screening is undertaken, as in Japan. Chronic atrophic gastritis, glandular dysplasia and adenomatous polyps are recognised as premalignant lesions, but the underlying aetiological factors are not understood. Surgery provides the only possibility of cure, but overt disease can be fully resected in less than 50% of laparotomies. Spread to regional nodes is associated with a uniformly poor prognosis, although radical regional lymphadenectomy may marginally improve prognosis. Japanese survival rates are reported to be better than Western results, and it is not clear whether this reflects a difference in the biology of the disease or a more aggressive approach to diagnosis and treatment. Adjuvant chemotherapy and radiotherapy strategies have made little difference to survival.
Histological features of the tumour which have been studied in relation to disease outcome include tumour differentiation, diffuse or intestinal-type appearance, depth of infiltration, lymphatic and vascular spread and host inflammatory response. Hattori (1984) reported an analysis of DNA ploidy patterns of 54 gastric carcinomas in Japanese patients. 68.4% of tumours were diploid. Diffuse-type and well differentiated intestinal-type cancers were commonly diploid, whereas poorly differentiated tumours often had a
mosaic of ploidy. Teodori (1986) reported the ploidy of 18 tumours which were biopsied endoscopically and 15 at surgery. The DNA index ranged from 1.18 to 3.13. Macartney (1986) reported the analysis of tumour ploidy of 14 fresh and 42 archival gastric tumours fixed in formalin from patients undergoing radical gastric resections. 73% of tumours were aneuploid. Tumours with or without lymph node metastases had similar ploidy characteristics. Fixation conditions clearly influenced the quality of the flow cytometry. The more recently fixed (less than 48 hours) specimens had a much lower coefficient of variation. There was no correlation between ploidy and tumour stage or histological type.
Ballantyne (1987) studied 77 archival primary gastric tumours. 71% were glandular and 86% were undifferentiated. There was no correlation between ploidy and tumour type, histological grade or pathological stage, or with survival to 36 months in the 44 patients followed up. Wyatt (1989) has studied retrospectively the relationship of tumour ploidy to prognosis of 76 gastric tumours from patients undergoing putative curative resections. DNA aneuploidy was associated with a poorer prognosis but was not predictive of survival as compared with the presence of lymph node metastases or tumour presence at the resection margin. A further 19 tumours yielded material unsatisfactory for flow cytometric analysis. 33 of 76 tumours were aneuploid. de Aretxabala et al (1988) reported the relationship between the DNA ploidy pattern of archival primary and metastatic gastric carcinoma in 58 patients. 33% of primary tumours and nodal metastases were diploid, whereas all liver metastases were aneuploid, with a higher proportion of polyploid cells. Aneuploidy correlated with shorter survival. It was concluded that tumour heterogeneity is a common phenomenon in gastric cancer, and may contribute to the evolution of the disease.
In a prospective study using FCM and in vivo labelling with BRdU, Riccardi et al (1988) reported the mean LI of 22 gastric tumours to be 9.9% (range 5.7-14.0%). The mean Ts of
17 patients was 15.2 hours (13.4-22.7) and the mean Tpot was 9.8 days (6.8-13.5). The follow up was too short for a prognostic study. Of importance was that tissue fixation was in 70% ethanol. Yonemura et al (1988) studied ploidy and proliferation of 129 cases of gastric carcinoma with in vivo BRdU labelling. Aneuploidy (62% of cases) was correlated both with worse prognosis and with higher BRdU labelling. The mean total BRdU labelling index was 6.0% compared with 9.0% in aneuploid tumours. This group also compared BRdU labelling and S phase fraction (SPF) with epidermal growth factor receptor (EGFR) expression measured in 242 gastric tumours. 76 of 242 tumours were EGF positive. These tumours tended to have both a higher BRdU LI and a poorer prognosis. It was suggested that the BRdU LI and EGFR expression may be useful prognostic markers of gastric cancer.
4:1:4. Gastro-oesophageal secretory mucosa.
The cell cycle duration of gastric epithelial cells is reported to be 48-72 hours. Lipkin et al (1963) used the FLM method in a patient with a gastrostomy (for carcinoma of the oesophagus) to calculate in vivo kinetic data. The cell proliferation index or growth fraction was one cell per 100 cells per hour in the normal gastric epithelium. G2 was more than two hours and the S phase was 10 hours. Similar data were calculated for normal ileal and rectal mucosa in two other patients (see also Lipkin, 1988).
The histological findings of intestinal metaplasia and dysplasia are often reported in association with atrophic gastritis in the absence of malignancy. It is possible to study the ploidy characteristics of gastric mucosa both of fibre-optic endoscopic biopsy specimens and in the surgically resected stomach. Capurso (1982) reported the DNA index of normal, gastric and pre-malignant (polyposis) mucosa. In gastritic mucosa, the DNA index was 1.1-1.4, and it was concluded that aneuploidy was associated with the premalignant condition. Odegaard et al (1987) studied gastroscopic biopsies of 11 patients with superficial
gastritis, eight patients with atrophic gastritis, 13 patients with histologically normal stomachs and 26 surgically resected stomachs. They found aneuploid cells in one patient with atrophic gastritis and one resected stomach (the reason for surgery was not stated) but concluded that in this limited study no difference existed in the cell cycle distribution between gastritic and normal stomachs. The study is nevertheless interesting for indicating the possibility of studying the cell cycle in endoscopic biopsies. The same team reported the results of endoscopic biopsies of 18 gastric tumours and nine gastric polyps. Two antral and five gastric body tumours were aneuploid (mean DNA index 1.57). They also found a variation between the proliferative (labelling) index of normal mucosa from body and antrum, which correlated with the ploidy of the associated tumour. Macartney (1986) reported that while aneuploidy was not found in normal or moderately dysplastic mucosa, it was present in five of seven cases of severe dysplasia and three of 11 cases of intramucosal cancer. The difficulty in the interpretation of histograms derived from archival material was highlighted in this paper.
4:2. Patients, materials and methods.
4:2:1. Tumours.
Six patients, five male and one female, with squamous carcinoma of the oesophagus were studied. Four underwent right thoraco-abdominal oesophagectomy (modified Ivor-Lewis) and two inoperable tumours were biopsied. One tumour was well differentiated, three were moderately and two were poorly differentiated. 27 patients, 21 male and six female, with adenocarcinoma of the distal oesophagus and stomach were studied. 21 patients underwent partial or subtotal gastrectomies. Six inoperable tumours were biopsied. No tumours were well differentiated. Seven were moderately and 20 were poorly differentiated. There were 15 aneuploid and 11 diploid tumours. A DNA profile but no kinetic data were obtained from one tumour. Two further male patients were
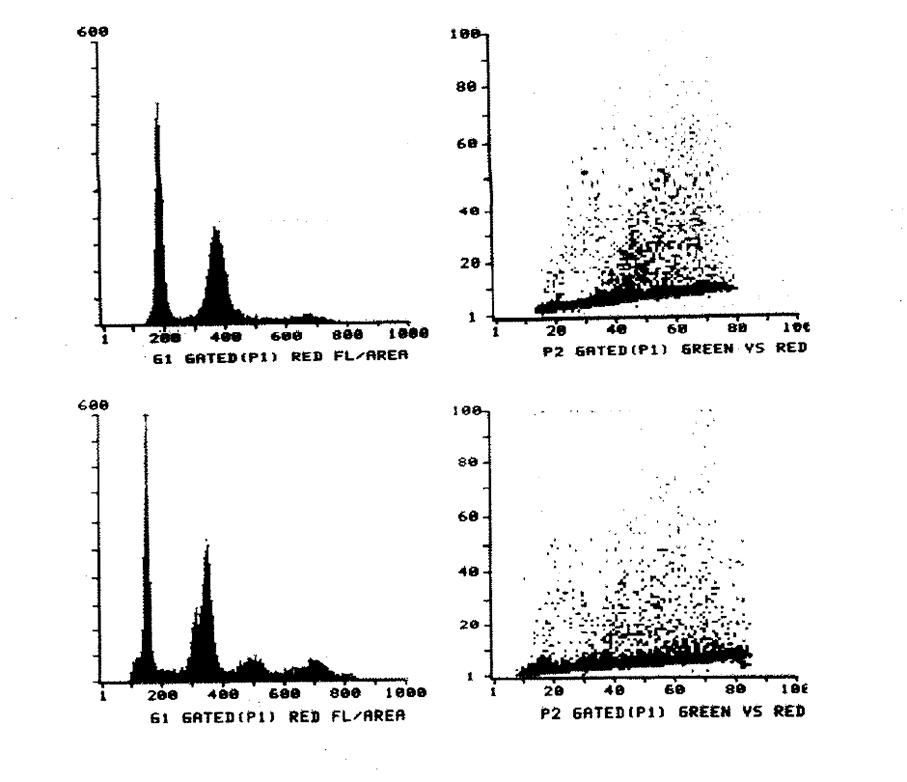
Figure 4:1.
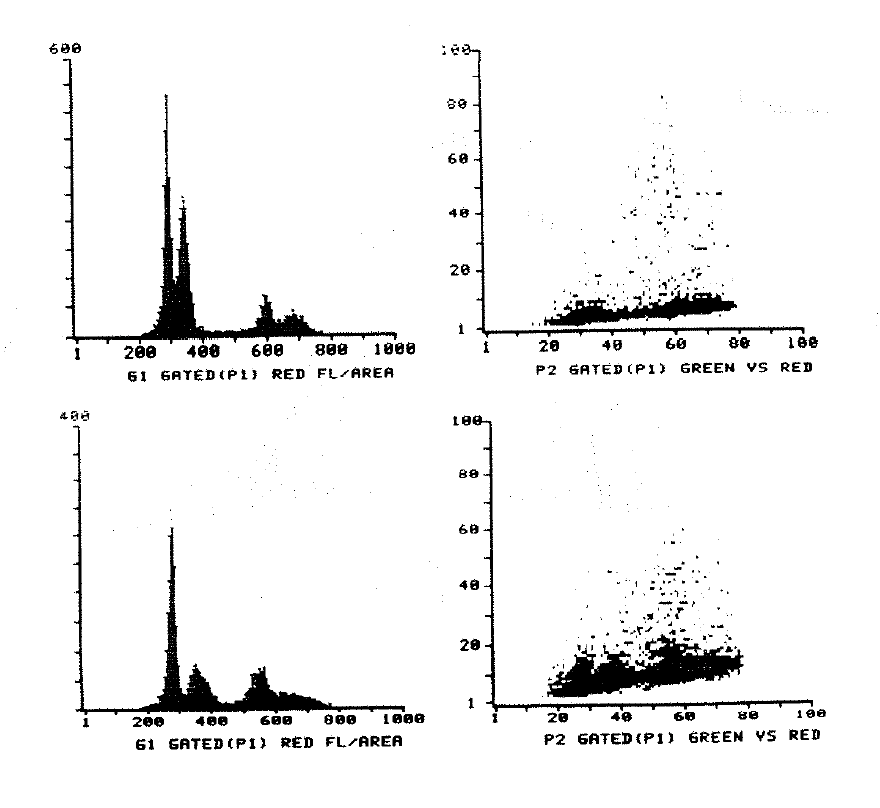
Figure 4:2.
4:3:1. Results
78 successful and 14 unsuccessful analyses of tumour and mucosal biopsies were performed. A summary of the results is given in Table 4:1.
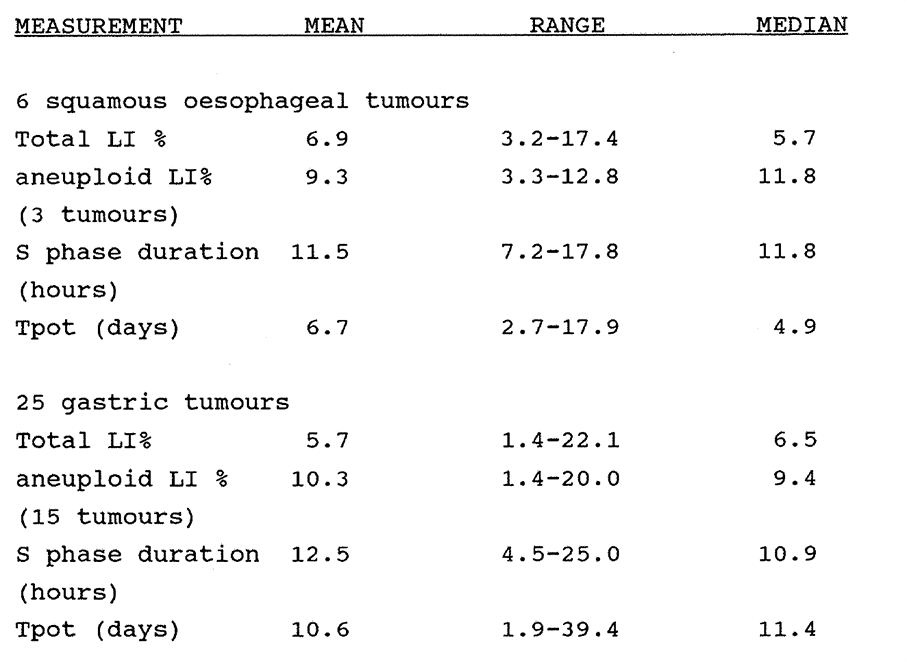
Table 4:1. The range of kinetic data of gastro-oesophageal carcinomas.
Multiple tumour biopsies were successfully measured in 12 patients and in these cases the data are calculated on the mean values of all specimens for each tumour. The data for these individual tumours are tabulated in Appendix 4:1.
The solitary lymphoma and pancreatic carcinoma were diploid. The labelling index, Ts and Tpot of the lymphoma were 0.9%, 8.3 hours and 30.9 days, and of the pancreatic carcinoma were 8.3%, 12.2 hours and 4.9 days. The data are summarised in the histograms in Figure 4:3.
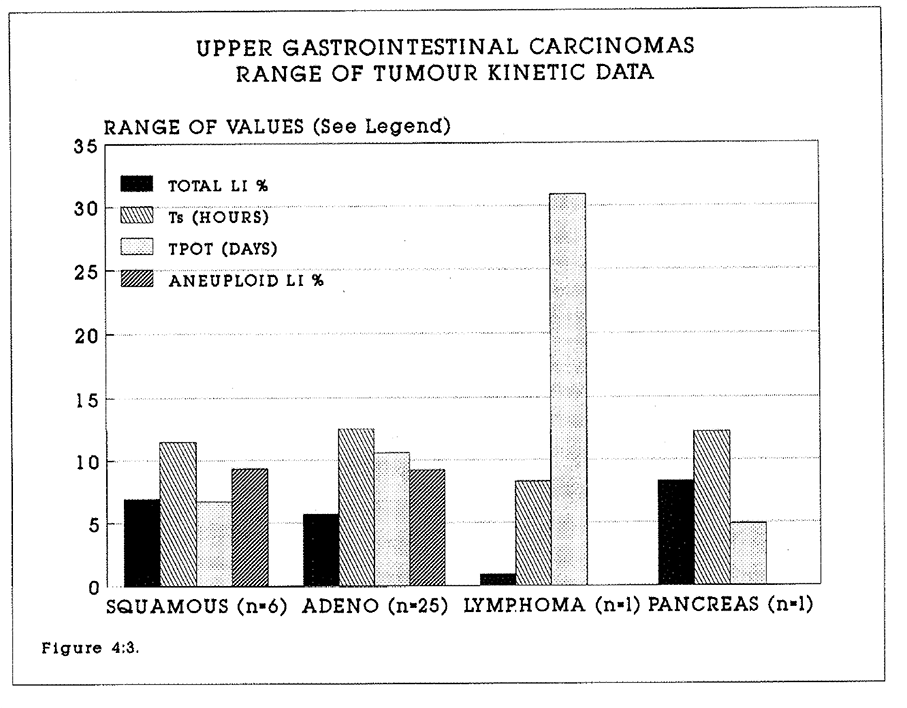
Figure 4:3. Histograms of the kinetic data of the upper gastrointestinal tumours studied. Mean values are represented by the bars. Standard errors are not shown.
4:3:2. Intra-tumour variation in data.
Satisfactory analyses were performed on multiple blocks from seven gastric adenocarcinomas. Three tumours yielded two blocks, four tumours yielded two blocks, and one tumour yielded four blocks. Two tumours showed significant variations in the DNA index, ranges 1.0-1.48 and 1.0-1.62 respectively. The maximum range of intra tumour variation in the total labelling index was 11.6% and in the aneuploid labelling index was 8.4%. The maximum range of intra tumour variation in the Tpot was 12.4 days.
4:3:3. The relationship between tumours and metastases.
In all except one tumour where kinetic data were obtained from both primary and secondary lesions, the DNA index was unchanged. In the one exception, the DNA index of the primary tumour was 1.7 and of the secondary, nodal metastasis was 1.0. There was no consistent pattern of higher proliferation in either primary or secondary tumour. The range of total labelling indices was +/-12.0% and of aneuploid labelling indices was +/- 5.0% (Appendix 4:C.).
4:3:4. The relationship between kinetic data and histological grade.
There were too few squamous tumours to be analysed for statistical significance. No significant difference was found between the total or aneuploid labelling index, the DNA index or the Tpot of moderately or poorly differentiated gastric carcinomas. The histological grade of gastric adenocarcinomas does not correlate with proliferation. The results are shown in Table 4:2.
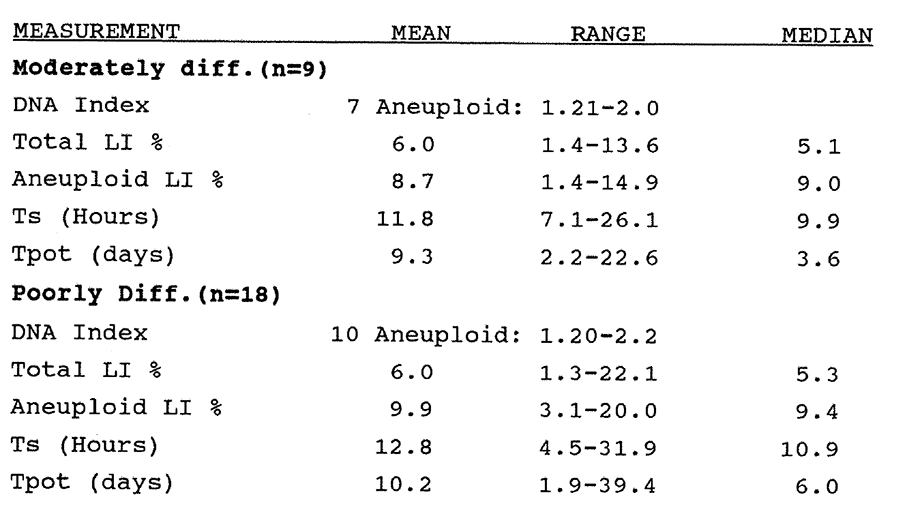 Table 4:2. The kinetic data of gastric adenocarcinomas sorted by histological grade. There was no significant difference between the mean values of the moderately or poorly differentiated tumours.
4:3:5. Gastro-oesophageal Mucosa kinetic data.
Normal mucosal growth is in a steady state, and the concept of the tissue turnover rate rather than the potential doubling time is appropriate to mucosal kinetics. Upper gastrointestinal secretory mucosa displays considerable anatomical variety and complexity, for example with branching glands. The potential doubling time data is therefore described without correction for the crypt:crypt + stromal cell ratio, and Crypt Turnover Rates have not been calculated. All normal mucosal specimens had diploid DNA profiles. The results are shown in Table 4:3.
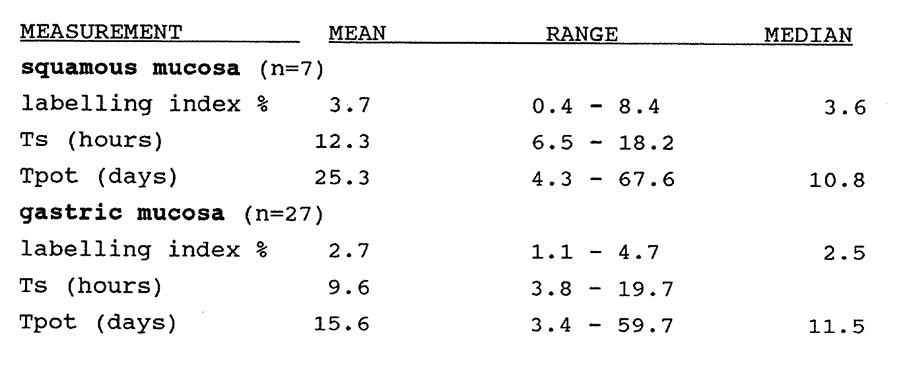
Table 4:3. Kinetic data from oesophageal and gastric mucosa. This has not been corrected for the crypt: total (crypt + stroma) cell ratio and is therefore not directly comparable to the data presented on colorectal mucosa.
The labelling index, Ts and Tpot of the one duodenal mucosa specimen were 3.0%, 10.5 hours and 11.6 days, and of the one jejunal mucosa specimen were 1.1%, 10.8 hours and 32.7 days. The data are summarised in the histograms in Figure 4:3.
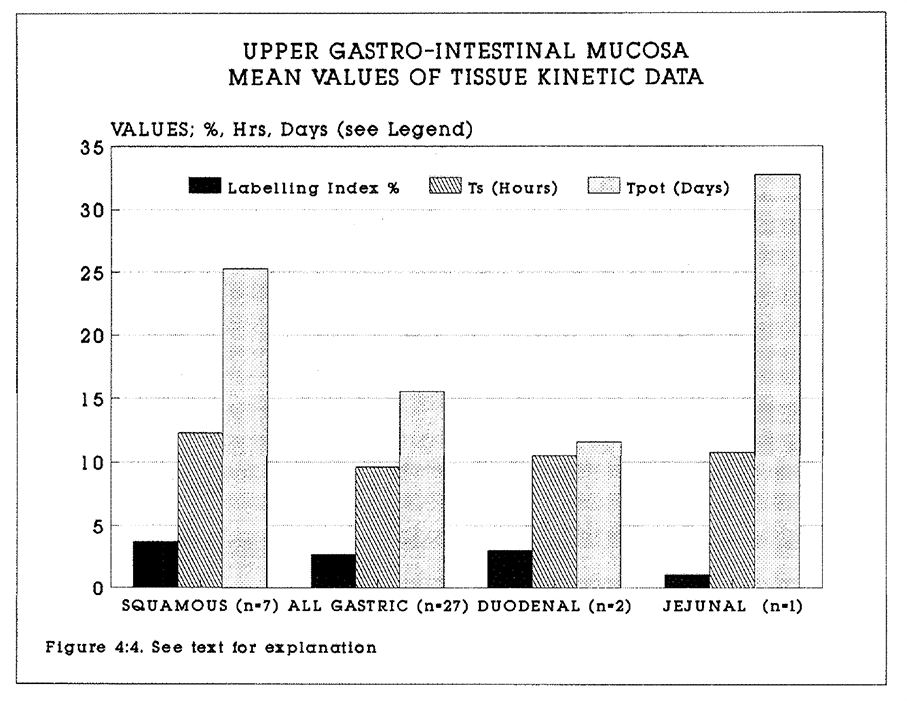
Figure 4:4. Histograms of the kinetic data of the upper gastrointestinal mucosa studied. Mean values are represented by the bars. Standard errors are not shown.
4:3:6. Immunohistochemical staining.
BrdU labelling was clearly seen in the small number of mucosal and tumour sections studied. In squamous mucosa, the proliferative zone was clearly distinguished in the peribasal layer. An example is shown in Figure 4:5. In the mucosa, staining was largely confined to the deep crypt proliferation zone. An example is shown in Figure 4:6. An example of a squamous tumour is shown in Figure 4:7. and of a poorly differentiated adenocarcinoma in Figure 4:8.
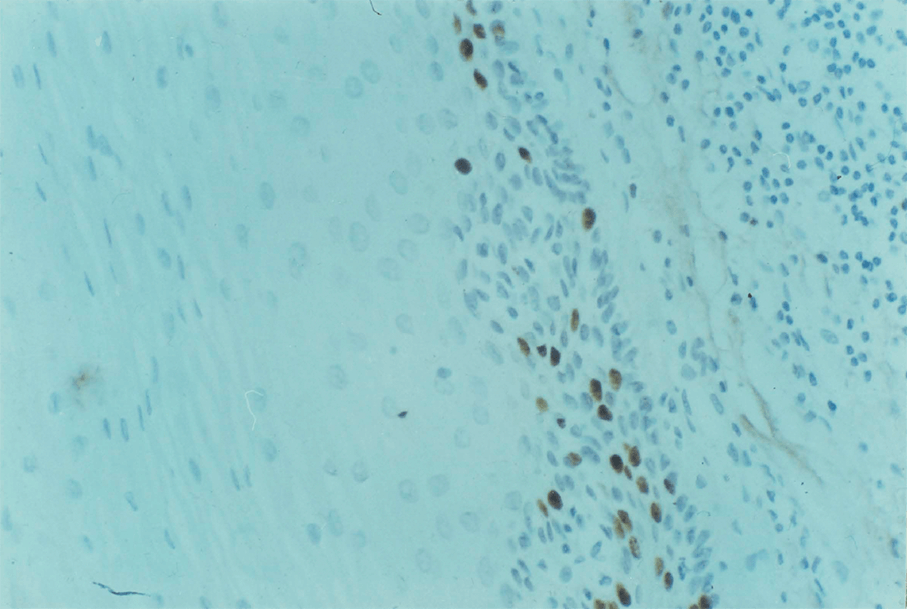
Figure 4:5. In squamous mucosa, the proliferative zone was clearly distinguished in the peribasal layer. This is clearly shown in this photomicrograph. Magnification x 25.
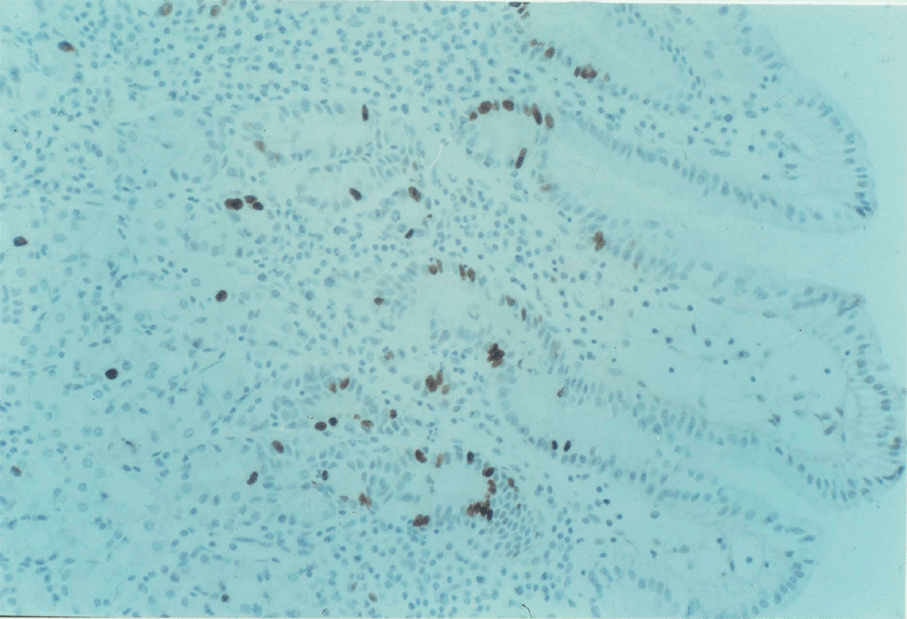
Figure 4:6. In the gastric glandular mucosa, staining was largely confined to the deep crypt proliferation zone, as shown in this section. Magnification x 25.
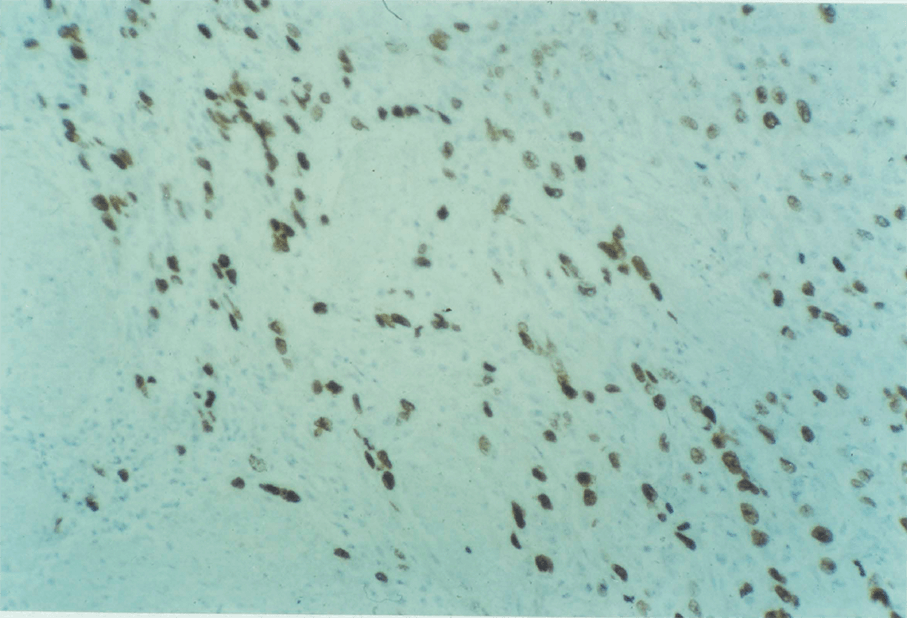
Figure 4:7. An example of a squamous carcinoma of the oesophagus is shown. Magnification x 25.
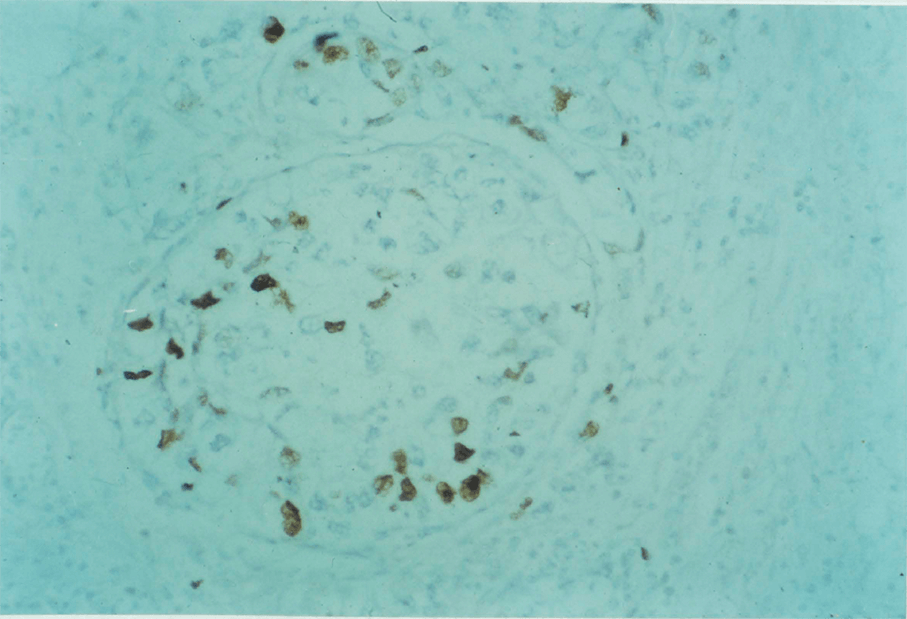
Figure 4:8. A poorly differentiated gastric adenocarcinoma is shown. Magnification x 25.
4:3:7. Clinical outcome.
Follow up as of 1st March 1990 was one month to 21 months. Nine patients with gastric adenocarcinomas have died in the intervening period. Two early post operative deaths occurred, due to cardiac failure at two days and due to a pulmonary embolism at four days. Two other patients died after two and four months of respiratory disease without proven evidence of metastases. Five patients are known to have died of progressive disease. The Tpots of these tumours were 39.4, 8.4, 4.1 and 1.9 days. One tumour could not be satisfactorily analysed. Of the six oesophageal squamous tumours, one patient has died of progressive disease after three months and one of bronchopneumonia after four weeks. Follow-up will continue on these groups.
4:4. Discussion.
The FCM/BRdU technique can be applied to the study of squamous carcinomas and adenocarcinomas, and to mucosa of the upper gastrointestinal tract. The ranges of data between patients, within tumours and between tumours and metastases have been described. The series of patients with squamous tumours is too small to draw conclusions concerning the relationship of tumour cell kinetics to prognosis. However, the ranges of data measured are similar to those of colorectal and gastric adenocarcinomas. The mean total labelling index is significantly lower and the mean Tpot is significantly longer in gastric than in colorectal adenocarcinomas. This may reflect more extensive fibrosis and necrosis in gastro-oesophageal tumours. This may also account in part for the higher failure rate of specimen analysis in this series of tumours.
The actual volume doubling time of primary gastro-oesophageal tumours is as difficult to quantitate as in colorectal tumours. Cell loss by exfoliation is an important feature of upper gastro-intestinal tumours, and indeed is used as a diagnostic aid in conjunction with endoscopy. The frequent finding of flat, non-exophytic tumours is almost certainly a
The result of exfoliation. The potential doubling times of tumours in this series are thus plausible even if actual volume doubling occurs slowly.
The cell kinetics of upper gastro-intestinal tract tumours have received less attention in the literature than colorectal tumours. Interpretation of published data requires caution because most flow cytometric studies have been performed on archival material. Histological reporting may vary from one pathologist to another. Most published series of kinetic data are too small to be of prognostic and therapeutic value. The data obtained in this series are very similar to that previously reported by Riccardi et al (1988) using similar methodology. In conclusion, a consistent pattern of in vivo proliferation kinetics has emerged in upper and lower gastrointestinal tract adenocarcinomas. This may reflect the existence of a unified tumour cell cycle control mechanism yet to be identified. The BRdU/FCM method is a practical means of studying the proliferation of gastro-oesophageal carcinomas and mucosa.
CHAPTER 5
Automated image analysis of immunoperoxidase staining.
5:1. Introduction.
The immuno-histochemical expression of cellular and nuclear antigens is frequently reported. Examples include the correlation of the expression of the proteins Ki-67 and Vimentin, (Raymond, 1989), c-erbB-2 product (Barnes 1989) and Epidermal Growth Factor (Sainsbury 1987) with the prognosis of breast carcinoma and the determination of the proliferation index of tissues labelled with BRdU (Sasaki 1988). Quantitative studies on immunohistochemically stained sections are hindered by the laborious nature of direct cell counting. Automated image analysers facilitate rapid counting of large numbers of stained histological features. In this study, measurements were made on 95 peroxidase stained sections of human gastrointestinal tumours and mucosa labelled in vivo with bromodeoxyuridine. The BRdU labelling index was calculated by manual and automated methods to yield a labelling index in 10 microscope fields in each section. A flow diagram of the method is shown in Figure 5:1. The method was also used to calculate mean areas of stain taken up by proliferating and non-proliferating cells.
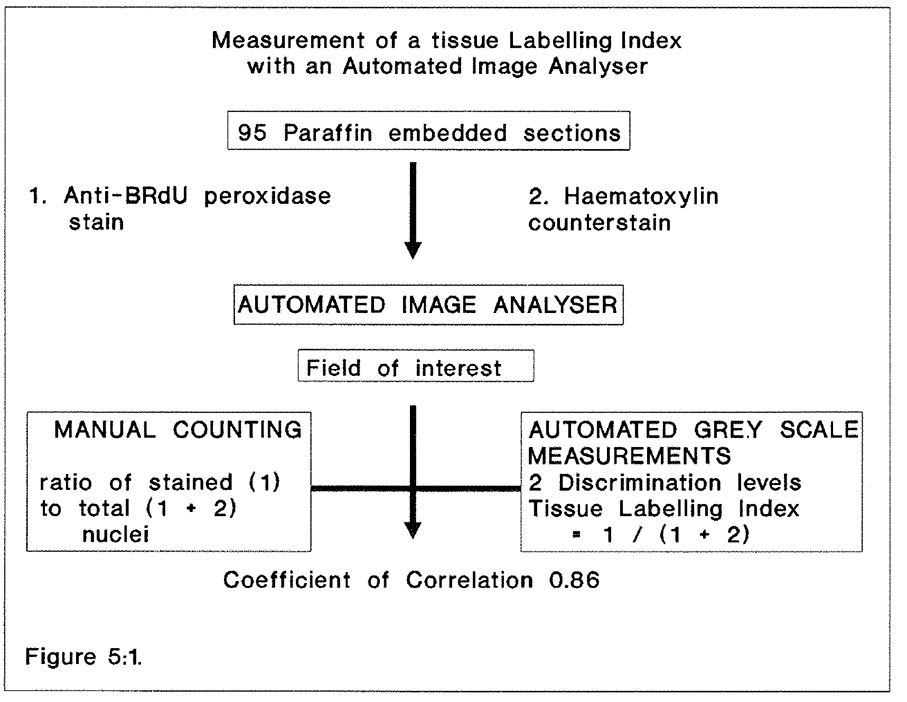
Figure 5:1. Flow diagram of the procedure by which comparisons were made between the labelling indices derived from flow cytometric and immuno-histochemical data.
Mayall (1988) states that certain conditions should be met in making cell measurements by image cytometry. Firstly, isolated objects such as cells should be studied. Secondly, immunochemical staining should be specific and stoichiometric. Thirdly, the technical advantages and limitations of equipment and data analysis should be understood. Fourthly, results obtained by one technology should be validated by other means where possible. Stained and unstained nuclei are rarely discrete in histological sections or in stained smears of cytological aspirates. The potential benefits of automation are such that this study was undertaken to assess whether image cytometry would facilitate the counting of features in tissue sections examined by light microscopy and whether the counting of the AREA of stained features was a satisfactory alternative to counting numbers of features in heterogenous populations of cells and nuclei. The image cytometer facilitates data collection from stained sections with confluent features of interest where the criterion of isolated features is not met. This is a new and potentially valuable application of an established technique.
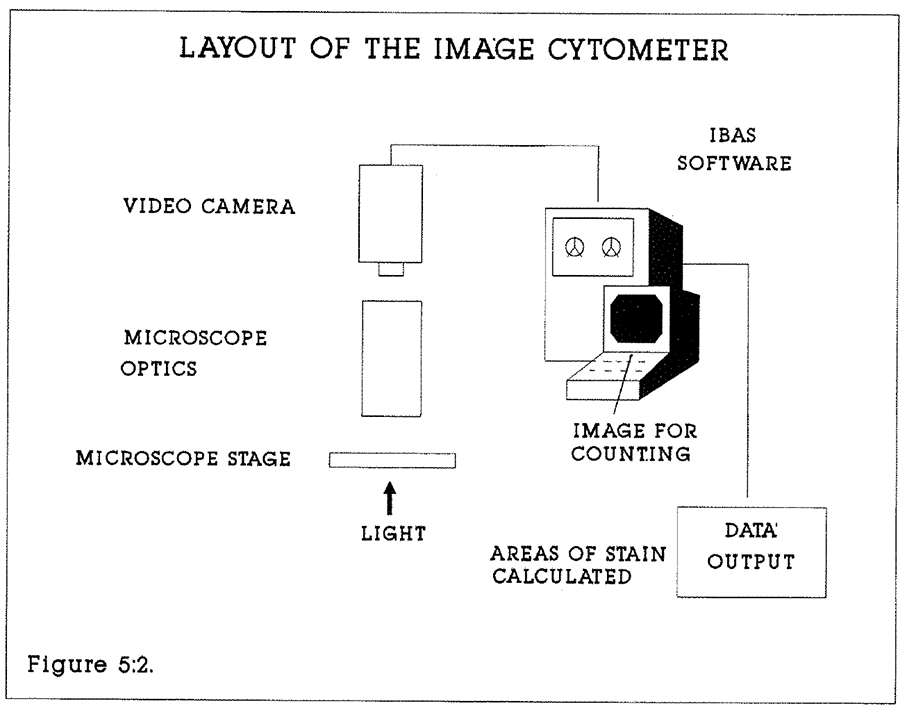
Figure 5:2. The layout of the image processing cytometer.
5:2. Materials and methods.
The automated image analyser.
A Kontron Image Analyser (Kontron Electronics Ltd., Watford UK) was programmed using proprietary Interactive Biological Analysis System (IBAS) menu-driven software to measure and display the total areas of nuclei and the areas of nuclei containing peroxidase stain in five micron tissue sections at x40 magnification. Values were calculated in square microns. The principles of operation of the image cytometer have been described by Mayall (1988). A diagram of the layout is shown in Figure 5:2.
The DISC2L (DISCrimination by 2 Levels) function of this software was used to separate the features of interest from the background by setting two discrimination thresholds. The
The machine measures light thresholds over 256 grey levels. In selecting features of interest, grey levels below or above the entered limits are measured as zero (black) and considered as background. Level 255 corresponds to white background. The lower the discriminant level needed, the darker the feature. Grey level limits are selected interactively by the investigator using a cursor. The image can also be analysed according to colour content be using colour exclusion filters or a colour video camera.
Specimens
95 5-micron tissue sections from formalin fixed, wax-embedded blocks were stained by the avidin-biotin peroxidase technique described in Appendix 2:C (Hsu 1981, Sasaki 1986, Hayashi 1988). The tissues were gastric and colorectal mucosa and tumours from patients as previously reported. Sections were cut on a standard laboratory sledge microtome.
Method of Analysis
The discrimination between brown peroxidase (BRdU) and background, and blue, haematoxylin counterstained nuclei and background, provided the basis for differential grey scale image analysis. Heavy blue counterstain in the presence of good BRdU staining was compensated by using a blue glass filter (Kodak K47) between the light source and microscope stage. Slides were inspected at x40 magnification. It is impractical to count individual cells or nuclei by machine, because they frequently overlap and images merge in 5 micron sections. The "area-derived" ratio of nuclear staining or labelling index (LI) was therefore measured.
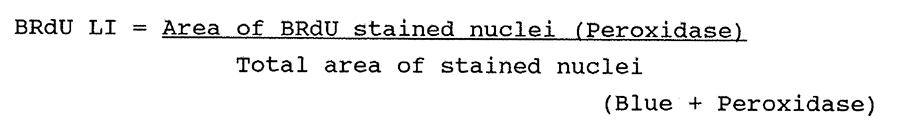
10 fields per microscope slide containing stained features were analysed, containing a mean number of 200 nuclei per field. Each field was measured both by computer (Nuclear
...stain ratio) and by eye (Nuclear counts), and the mean labelling index of each set of 10 measurements was calculated and plotted. The relationship between computer generated and observer generated labelling index was assessed by linear regression analysis.
It was also possible to estimate the size of the labelled and unlabelled nuclei from the area of staining. The total area of BRdU stain and the total area of counterstain are measured automatically. The numbers of nuclei are counted manually. The mean areas of stain and counterstain are calculated from the formulae:
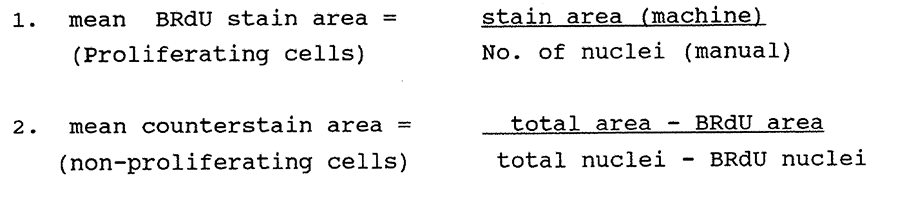
5:3. Results.
Staining quality is a product of the intensities of both primary stain and counterstain. This assessment is quantifiable by grey scale measurements. Peroxidase stained nuclei were discriminated in the grey scale range 47 to 113 units, and counterstained nuclei between 122 and 189 units. Variations outside these ranges were not measureable by machine and sections were rejected or restained. Each specimen therefore has two optimum assigned values. An example of the procedure is shown in Figure 5:3. The same field of a stained section of human rectal mucosa is photographed from the computer screen a) unprocessed, b) enhanced for immunochemical staining and c) enhanced for both immunochemical (BRdU) and counterstaining. As an example of this procedure, Table 5:1 shows how the calculations were performed on a typical section of a rectal carcinoma (RCT010). Visual and machine measurements were each made on the same fields. The flow cytometric total LI of this aneuploid tumour was 10.1%.
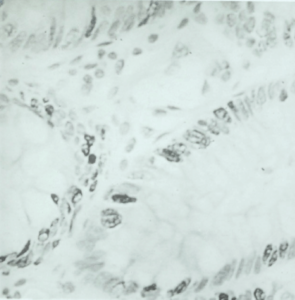
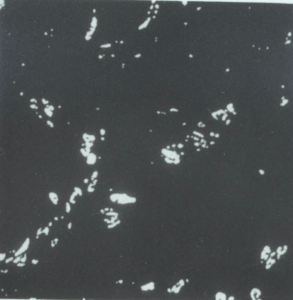
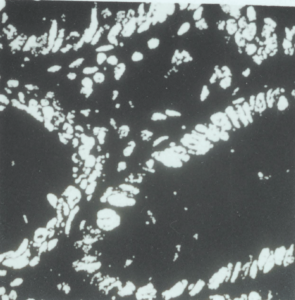
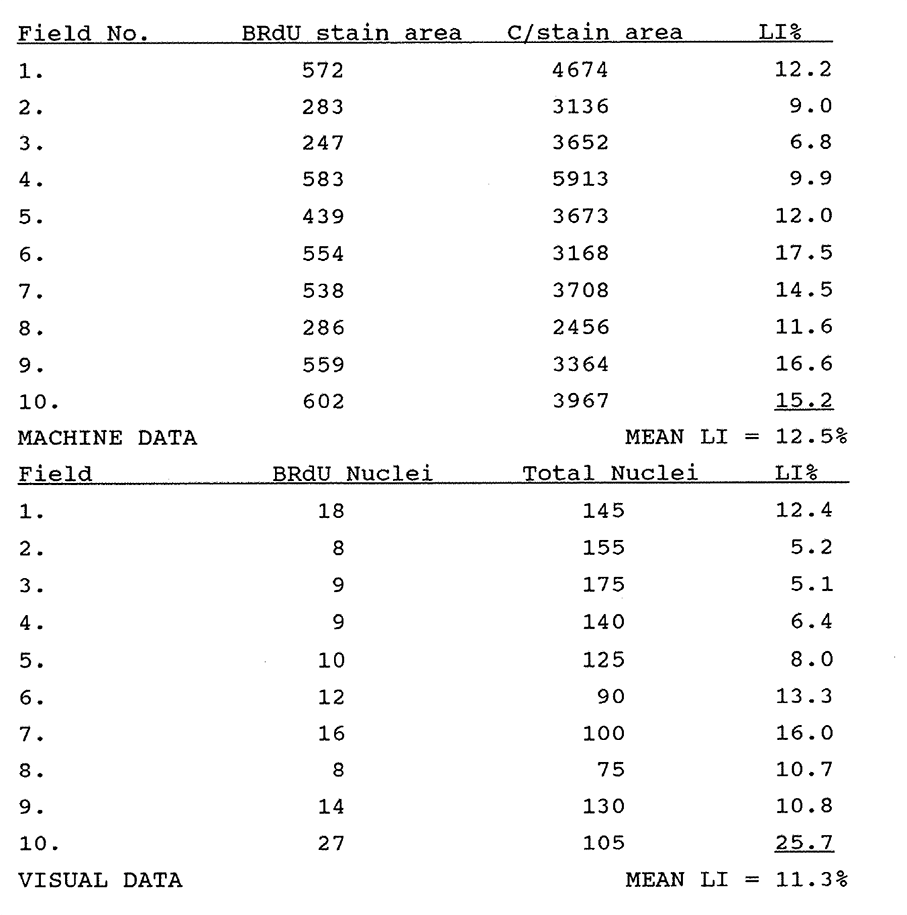
Table 5:1. This table illustrates the data used to calculate machine derived and visually derived labelling indices. A similar table was made for each of the 95 sections studied. Fields containing BRdU labelled nuclei were selected at random within the section. Areas without staining were not studied and therefore the mean labelling index of the fields studied was not necessarily representative of the entire section. Calculation of the tissue section LI was not the objective of this study, although this would be possible using a more truly random selection of fields.
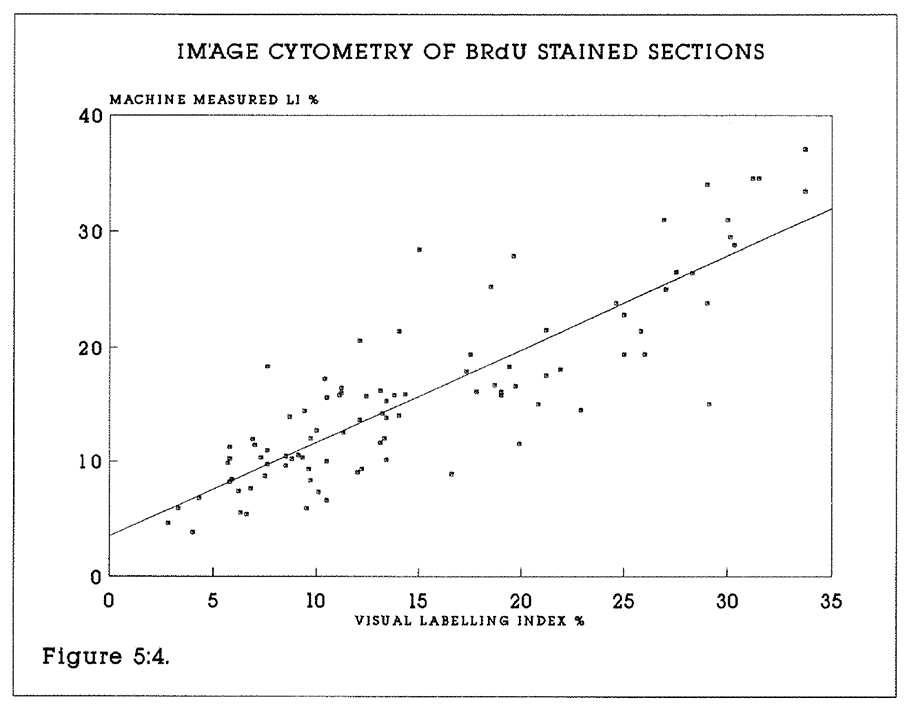
Figure 5:4. The result of plotting the labelling index obtained visually against the machine performance for all 95 specimens is shown. The coefficient of correlation is 0.86.
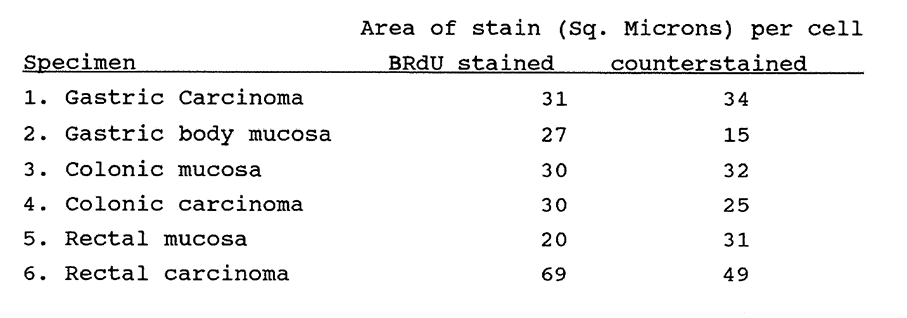
Table 5:2 see text
An additional use of image cytometry data is that it can be used indirectly to measure the mean (stained) area of cells or nuclei. This is illustrated in Table 5:2. Representative values for the areas of stain (Sq. microns) of primary stained and counterstained cells calculated as described above. 10 fields were measured and counted in each section, approximately 2000 nuclei per specimen.
5:4. Discussion.
Computerisation of the cell counting process on planar sections increases productivity (Henderson 1982). "Image Plane Scanning" is one method of automated image analysis. The image displayed can also be used for direct "manual" counting of cells. This allows the direct comparison of features in standardised fields, and also improves operator comfort and efficiency. The computer lacks the discriminatory powers of the human eye and brain in the counting of overlapping cells. However, when presented with a standardised algorithm it will provide a reliable source of data. The image cytometer and the human operator are complementary to this process.
The principal limitation of the technique is that discrimination must be attainable between the populations of interest. The quality of stained slides is impaired by inadequate primary or counter-stain, by uneven primary staining or by heavy counterstain. Such specimens may still be discriminated by the naked eye. The discrimination levels must be reviewed from slide to slide by the operator. This procedure can be time consuming when small numbers of fields are to be counted in each of large numbers of slides. Consistency of staining quality is not mandatory, because the operator has the facility to reset discrimination levels. Use of the machine achieves optimum efficiency where large numbers of fields of cells are counted on any one section.
The automated plane image analyser has been underutilised in the quantitation of immunohistochemical staining. This is in part due to the perception that it is unsuitable for use on tissue sections containing confluent features of interest. In this chapter it has been demonstrated that it is not necessary to meet the criterion of isolated features in order to measure stain ratios, or labelling indices, in tissue sections. There are inaccuracies in both visual counting and machine counting. In the former, errors arise in over- and undercounting, from perceptual difficulties with overlapping and poorly discriminated features, and from fatigue. The machine, while measuring with great precision the area of stain within a defined range, is unable to distinguish stain debris and heavy counterstain, or stain diffusion, from the feature of interest. Machine measurements take no account of artifacts of stain in the plane of the section. Slides with minimal stain artefact are necessary for accuracy. The machine derived LI will also be affected by heterogeneity of nuclear size.
The method provides a satisfactory measurement of the true labelling index. It appears to be of general application to the study of immunochemically stained sections. The method lacks sufficient accuracy for very detailed studies of antigen labelling, for which flow cytometry may be more appropriate. However, automated planar image counting should encourage researchers to be quantitative to within a 10% error when reporting the immunochemical labelling indices of specimens. Grey scale image planar scanning is a practical means of calculating a labelling index.
CHAPTER 6
The In vivo kinetics of human breast carcinomas.
6:1:1. Introduction.
Carcinoma of the breast causes approximately 15,000 deaths in the United Kingdom every year. The aetiology and the sequence of events leading from early, pre-invasive to advanced disease are not fully understood. Because of its clinical importance and the unpredictability of its behaviour, biological characteristics have been sought which correlate with its clinical prognosis, and which may be a guide to improved therapy. At the tissue level, these features include the histological grade and tumour stage. At the cellular level, they have included clonogenic assays of cell growth (Smallwood 1985). At the molecular level, flow cytometry, DNA hybridisation techniques and monoclonal antibodies have been used in research into the disease. Features measured fall broadly into three categories. These are:
- The DNA content of tumours and their ploidy index.
- The expression of proliferation associated nuclear antigens such as Cyclin, Ki67 and the c-myc oncoprotein.
- The expression of other antigens associated with tumour cells such as oestrogen and progesterone receptor status, epidermal growth factor (EGF) status, and the cytoskeletal protein Vimentin (Raymond 1989).
O'Reilly and Richards (1990) have observed that to be of general use a prognostic factor should be easily measurable, give reliable and reproducible results, and allow wide separation of prognostic groups. No one factor performs this role in node negative breast cancer, although tumour size and the presence of nodal metastases correlate well with the relapse free interval in node positive cancer. A satisfactory indicator would be of great value in allocating appropriate treatment to patients with node negative disease. For this reason, a study was undertaken to assess the value of flow cytometric kinetic data in a series of breast carcinomas.
6:1:2. The rate of growth of breast carcinomas.
Many historical studies of breast tumour growth and kinetics have been reported against which the BrDU/FCM data can be compared. Primary breast tumours are often accessible to physical measurement and hence to estimation of the volume doubling time if serial measurements are recorded. Serial mammography measurements allow quantitation of volume growth where clinical circumstances permit. Such studies have suggested that a long doubling time is associated with a good prognosis (eg Kusama et al 1972).
The S phase fraction (SPF) has been a frequently used index of breast tumour proliferation. It has been calculated from radioisotope studies, in which case it is a measure of the radiolabelled cells in a population, or by flow cytometry, in which case it is the fraction of nuclei in the S phase between G1 and G2 on the DNA histogram. More recently, BrDU has been substituted for 3H-Thy in in vitro studies. Using 3H-thymidine, the SPF has been found to range between 2.2% and 6.6% by both in vitro (Gentili, 1981, Meyer, 1983) and in vivo labelling (Straus 1980). In a series of 168 tumours McDivitt (1986) found a close correlation between the in vitro TLI and the S phase fraction. The mean TLI was 7.5% (range 0.2-23.1%) and the mean SPF was 8.0% (range 1.1-24.4%). In an earlier series of 30 tumours (1984) he reported that the mean TLI was 7.3% (median 5.6%, range 0.3-20%). The mean SPF was 7.5% (range 1.6-24.6%). Many other in vitro labelling studies of human tumours have been reported (see Gentili, 1981, Meyer, 1983, McDivitt 1984, 1986, Silvestrini 1985, Meyer 1989). Examples are given in Table 6:1.
Limited in vivo radioisotope studies have been performed on human breast carcinomas. Young and DeVita (1970) calculated a cell cycle time (Tc) of 19-24 hours in three breast tumours using 3H-Thymidine labelling and serial biopsies of large, subcutaneous tumours.
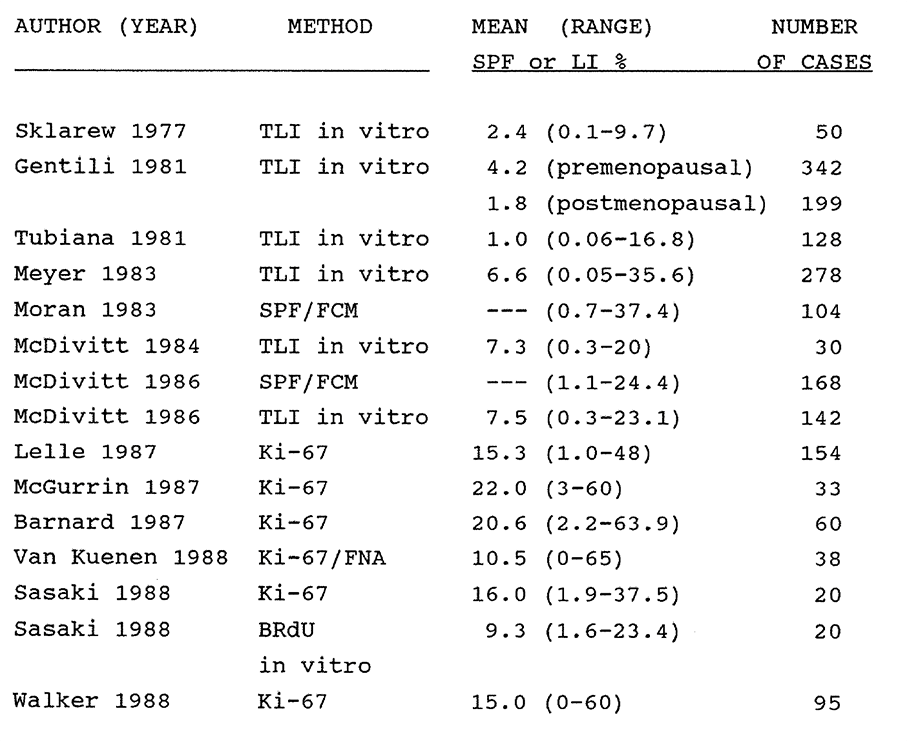
Table 6:1. A list of selected references reporting the proliferation kinetics of human breast tumours as measured by in vitro thymidine labelling, Ki-67 expression, the flow cytometric S phase fraction (SPF/FCM) or BRdU incorporation. Given are the mean and range of values of all tumours regardless of node or menopausal status.
Proliferation data has been compared with other prognostic markers in multifactorial studies. For example, the proliferation of human breast tumours measured by TLI or FCM is higher in undifferentiated tumours (Courdi 1989). Meyer (1983) studied 227 women treated by radical mastectomy. The probability of relapse at four years was 20% for tumours with a TLI below the median of 4.6%, whereas it was 52% for tumours with a TLI above the median, regardless of node status. The abilities of the TLI and nodal status to predict early relapse were equally strong and independent, so TLI
labelling conferred no advantage in node positive tumours. Silvestrini (1985) found that patients with slowly proliferating tumours had a higher probability of six-year relapse free survival (80.5%) than did rapidly proliferating tumours (59.6%). The median LI was used to distinguish fast from slowly proliferating tumours. The median LI was 4.6% in pre- and 1.4% in post-menopausal women. Studies have shown that the labelling index is higher in breast tumours lacking sex steroid receptors (Kute 1981, McDivitt 1986, Dressler 1988). Courdi (1989) reported that the in vitro TLI of 167 node negative human breast carcinomas was a significant indicator of relapse-free survival, unlike age, histological grade or ER status.
6:1:3. Other markers of breast tumour proliferation.
A variety of tumour and proliferation-associated markers have recently been reported against which BRDU/FCM data might be compared for prognostic purposes. Ki-67 is a mouse monoclonal antibody which detects a nuclear antigen that is present in all phases of the cell cycle except G0 and early G1 (Gerdes 1984). The antigen can be measured in tissue sections (Barnard 1987) or in cellular aspirates (Van Kuenen-Boumeester 1988) by staining with the avidin-biotin complex method. It is unstable if not stained fresh or in frozen sections. McGurrin (1987) reported that in a series of 33 invasive breast carcinomas, high Ki-67 labelling was associated with high mitotic rates but was inversely related to ER content. The range of labelling was 3% to 60%. Barnard found a similar correlation between Ki-67 staining and the mitotic index, but not with tumour size, node status, ER content or menopausal status. Lelle (1987) studied 154 invasive tumours and 41 benign lesions. Mean Ki-67 labelling in tumours was 15.3% +/- 10.1% but only 4.4% +/- 2.6% in benign lesions. Node positive tumours had significantly higher Ki-67 labelling. Walker and Camplejohn (1988) reported the reactivity of 95 breast carcinomas to Ki-67. 56% of tumours showed nuclear staining with an LI of less than 1.0 to 60%. 26% of tumours showed cytoplasmic staining and 18%
were negative. The DNA index and S phase content were also calculated in 47 tumours. They were unable to relate their findings to prognosis. Raymond (1989) found an inverse relationship between Ki-67 expression and ER status in 74 breast tumours. In a limited study of 20 tumours including five breast carcinomas, Sasaki (1988) reported the relationship between the labelling indices of Ki-67 and in vitro BrdU in human malignant tumours. They found that the Ki-67 labelling index was higher than and parallel to the BrdU labelling index.
Expression of the c-myc gene protein product p62c-myc is known to be cell cycle dependent. The protein has been investigated as a proliferation marker in breast cancer. Locker (1989) measured p62c-myc in 141 breast cancers by flow cytometry using the 6E10 antibody. High levels of p62 c-myc were found in well differentiated tumours. No correlation was found with DNA ploidy, lymph node or ER status, or survival. It was concluded that p62c-myc is not a useful prognostic marker. This study was performed on archival material with its attendant disaggregation and artefact problems.
6:1:4. EGF, CerbB-2 and breast tumour proliferation.
Monoclonal antibodies have been produced against growth factor receptor proteins such as EGFR and C-ErbB-2, which although not strictly proliferation markers may be indirectly linked to the control of breast tumour proliferation and have been studied as possible prognostic markers.
Epidermal Growth Factor Receptor expression is an indicator of poor prognosis in women with operable breast cancer, particularly in node negative patients. The protein is detected in tumour biopsies by a competitive binding I-125 labelled EGF assay or by immunohistochemistry. Sainsbury (1987, Nicholson 1989) has reported a six-year follow-up of 231 patients with operable breast cancer. 35.5% of patients had EGFR positive tumours and 47% had ER negative tumours. In node negative patients at five years follow up the probability of survival was 85% for EGFR negative tumours but less than 30% for EGFR positive tumours.
The proto-oncogene C-erbB-2 encodes a trans-membrane growth factor receptor protein which is amplified in 30% of breast carcinomas and is associated with a poor prognosis (Barnes et al, 1989). It can be detected by immuno-histochemistry on frozen sections. It is expressed by in situ ductal tumours, particularly by comedo type tumours with large pleomorphic cells. Its value as a prognostic marker has not yet been established. Walker (1989) performed an immunohistochemical and in situ hybridization study of c-myc and c-erbB-2 expression in 38 formalin fixed archival primary human breast carcinomas. It was concluded that both methods were satisfactory for future studies of c-erbB-2 expression in relation to prognosis, but that p62c-myc measurement was unsatisfactory owing to fixation problems.
6:1:5. Proliferation and breast tumour metastases.
Tubiana and Courdi (1989) reviewed the relationship between the probability of metastatic dissemination and long term survival of the cell proliferation kinetics of human breast tumours as represented by the S Phase Fraction (SPF). They found that the SPF had a higher independent prognostic significance in a number of studies which they reviewed than did ploidy analysis, sex steroid receptor status, lymph node status or histological grade.
Hitchcock (1989) reported the DNA ploidy, histological grade and tumour related immuno-reactivity in 36 cases of advanced breast carcinoma with axillary node or ovarian metastases. Differences between primary and metastatic tumours were found in 44% of DNA ploidy results, 44% of histological grades and 28% of Carcino-Embryonic Antigen (CEA) results. The development of metastatic disease clones did not appear to be related to consistent changes in any of the factors examined.
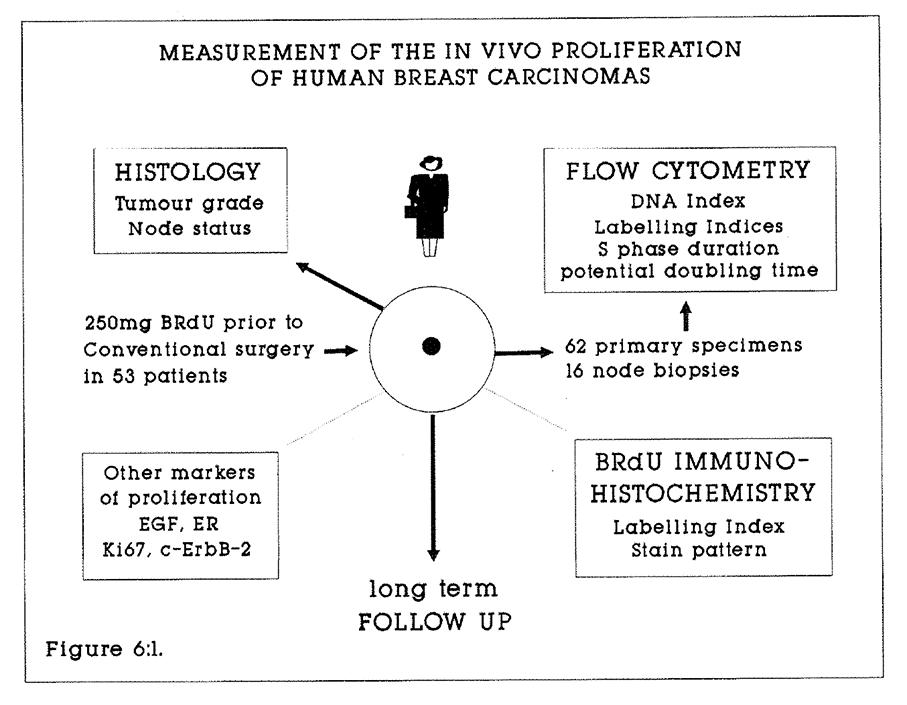
Figure 6:1. A flow diagram to illustrate the study of breast tumour proliferation by in vivo BRdU labelling. Long term follow-up and correlation of BRdU labelling with other tumour markers will be undertaken.
6:1:6. BRdU and breast tumour proliferation.
The in vitro incorporation of BRdU into human breast carcinoma cells is an established technique. For example, Waldman et al (1988) have demonstrated the feasibility of measuring the in vitro BRdU incorporation into cellular needle aspirates of breast carcinomas. The in vivo incorporation of BRdU into breast carcinomas has not been studied as a marker of proliferation or as a prognostic indicator.
6:2. Patients, materials and methods.
There were 53 patients studied with invasive ductal adenocarcinoma of the breast. The age range was 39 to 80 years. There were 13 pre- and 40 post-menopausal patients. Patients underwent simple mastectomy or wide local excision with axillary clearance. Each patient consented to receive a single intravenous dose of 250mg BRdU administered over 30 seconds in 10ml saline, between 2.0 and 8.6 hours prior to conventional surgery. No toxicity was associated with this procedure. Specimens were stored in 70% ethanol at minus 20 degrees in a commercial freezer.
Tumour disaggregation.
Breast tumours do not yield nuclear suspensions suitable for multiparameter flow cytometry with the ease of gastrointestinal tissues by the method previously described. There appear to be two principal reasons for this. The first is the high fat content of the tissue, which impairs pepsin digestion. The second is the collagenous nature of the tissue. Tumours were disaggregated by mechanical dissection to yield 1mm cubes of tissue. This was followed by incubation in 0.4mg/ml Porcine Pepsin (Sigma) in 8ml 0.1M HCl at 37ºC in a rotary agitator. 100 microlitres of Tween 20 (Sigma) was added to each vial to emulsify the fat. The resulting suspension of nuclei and cellular fragments were filtered through a 35 micron mesh and centrifuged at 1500 rpm for five minutes.
Following disaggregation, breast tumour nuclei were processed, stained and analysed by flow cytometry in the same manner as previously described for colorectal and gastro-oesophageal tumours. Tumour blocks from which specimens displayed excessive digestion as evidenced by excessively broad or uninterpretable G1 and G2 peaks were resampled. Disaggregation was attempted in concentrations of 0.1-0.4mg/ml porcine pepsin in 0.1M HCl for periods of 20 to 60 minutes, and nuclei were denatured in DNA for between eight and 14 minutes.
6:3:1. Results.
There were 62 specimens of primary tumour and 16 axillary nodal metastases studied from 53 patients with invasive ductal adenocarcinoma of the breast. Ten primary tumours and three node samples failed to yield interpretable histograms after two analyses. A further nine tumours with satisfactory uptake of BRdU yielded histograms from which a ploidy index could not be calculated. Of the other tumours, 17 were diploid and 19 were aneuploid, with DNA indices ranging from 1.16 to 2.63. Of the analysable tumours, there were 20 node negative and 24 node positive cases.
6:3:2. The total labelling index.
A BRdU total labelling index was calculated in 23 primary node negative tumour specimens, 29 node positive tumour specimens and in 13 node metastases. The results are given in Table 6:2. The individual tumour data are given in Appendix 6:A.
There was no significant difference in the total or aneuploid labelling indices between node negative or positive tumours. The total labelling index of nodal metastases would be expected to be raised by the presence of labelled lymphocytes in the nodes. The fact that the total LI of nodes was lower than of the primary lesions indicates that measurements were most probably made on tissue totally replaced by tumour.
An uncorrected total labelling index was estimated in 23 specimens in which the G1, S and G2/M phases of the DNA histogram could not be satisfactorily distinguished by gating on the green versus red peak histogram in the region of 200 to 400 units of red fluorescence. In these specimens the labelling index will have been marginally overestimated by one half of the total number of nuclei in the G1 phase.
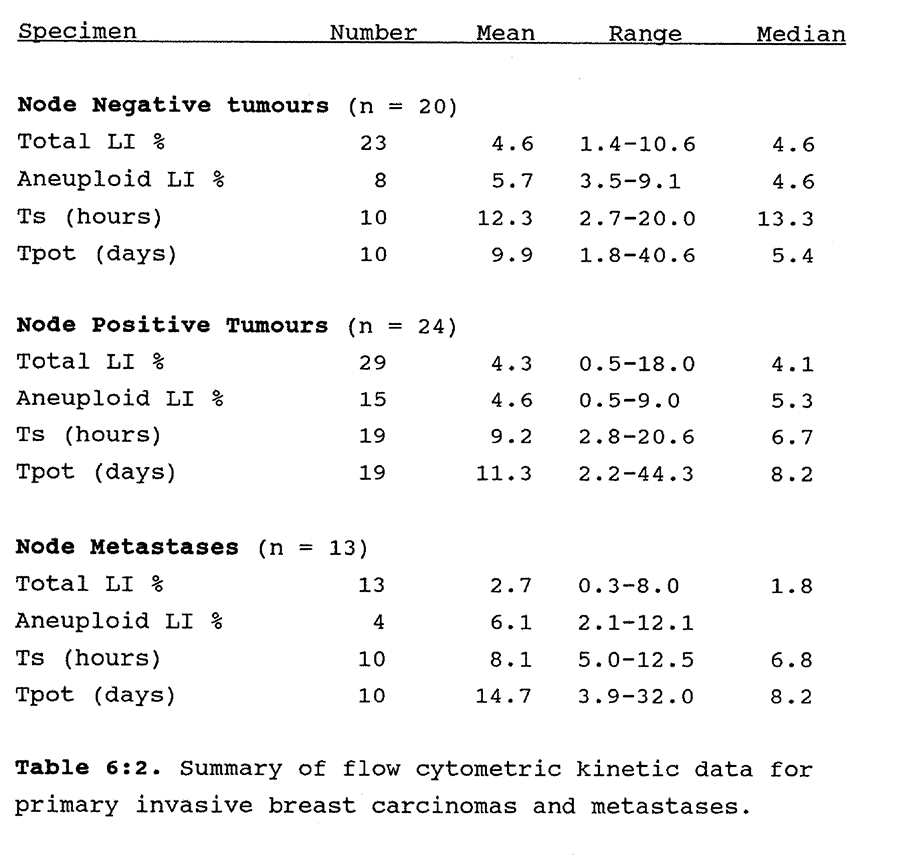 Table 6:2. Summary of flow cytometric kinetic data for primary invasive breast carcinomas and metastases.
6:3:3. The S phase duration and the potential doubling time.
There was a trend to a shorter Ts and a correspondingly longer Tpot in the node positive tumours. The range of Ts values was wide and the calculated S phase duration was particularly short (less than 3.0 hours) in tumours in which the time from injection to biopsy was also less than 3.0 hours. In these tumours insufficient time may have elapsed for early S phase labelled nuclei to incorporate sufficient antigen for stoichiometric detection by the primary antibody. A disproportionate number of late S phase nuclei will then appear to shift the RM towards unity, and the calculated Ts will be too short. This data supports the view that at least three hours should elapse between injection and biopsy if reliable time-dependent data are to be calculated from BRdU labelled nuclei on the FCM histogram. Over shorter time intervals a valid estimate of the BRdU labelling index may still be obtained.
A wide range of Tpot values was also found. This generally reflected variation in the labelling index rather than the Ts (Appendix 6:A). For example, the Tpot of BST002 was 44.3 days, the Ts was 10.1 hours, and the total labelling index was only 0.8%. The range of potential doubling times was much wider than in colorectal carcinomas. This may produce a better discrimination of eventual outcome, and the clinical follow-up will be of great interest.
6:3:4. Histological grade.
All tumours were invasive duct carcinomas. Two were reported as having a predominantly scirrhous component, and one as a medullary tumour. Of those which were further classified, eight were poorly differentiated, six were moderately and one was well differentiated. There was no discernible relationship between grade and any of the measured kinetic parameters in these tumours.
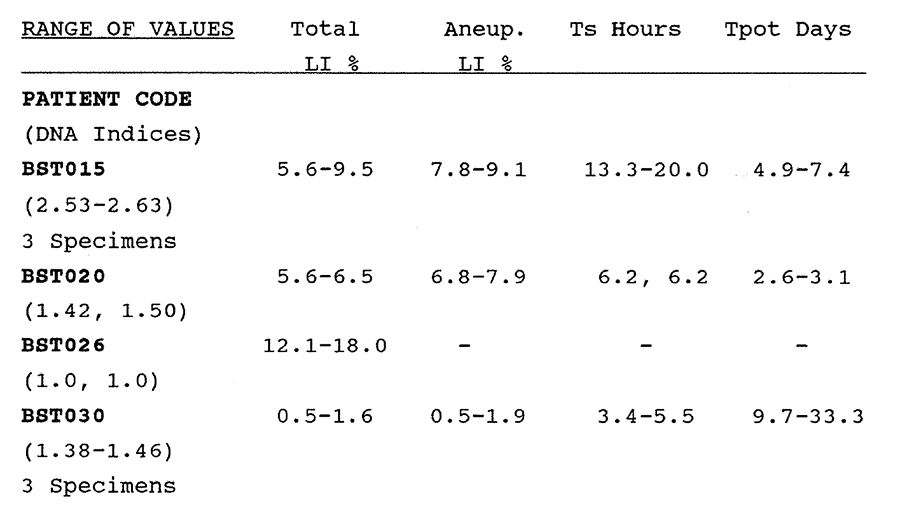
Table 6:3. The variation in the kinetic data in four patients from which multiple (two or three) specimens were analysed.
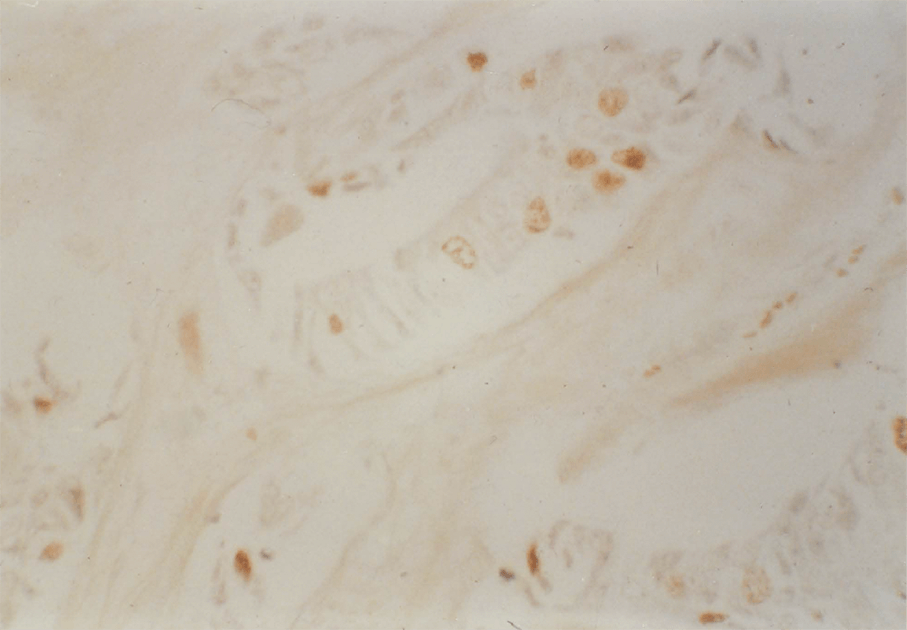
Figure 6:2. A poorly differentiated invasive ductal carcinoma of the breast (BST015). The total labelling index by flow cytometry was 7.3%. (Magnification X 40).
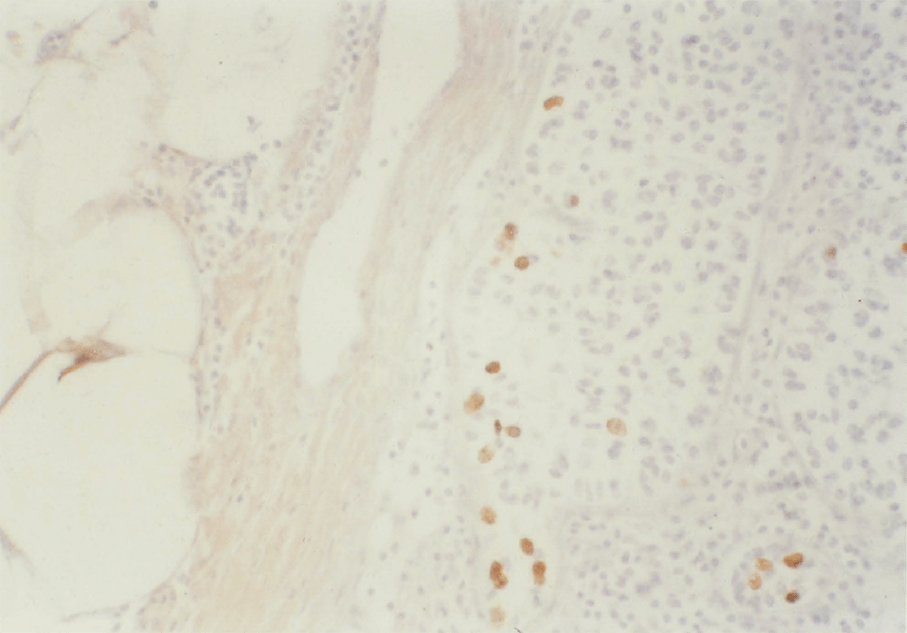
Figure 6:3. A metastasis of an invasive ductal carcinoma of the breast in a lymph node (BST016). The total labelling index by flow cytometry was 4.2%. (Magnification X 25).

Figure 6:4. An example of a slowly proliferating moderately differentiated breast carcinoma (BST013). The FCM labelling index was 1.8%. (Magnification X 25).
6:3:5. Immunohistochemical staining.
Representative histological sections were stained for BRdU (Appendix 2:C). The labelling index assessed by visual estimation was less than 10% in all cases. Labelled carcinoma cells were widely dispersed within the tumour. Examples of BRdU staining of breast carcinomas are shown in Figures 6:2, 6:3 and 6:4.
6:3:6. Intratumour variation.
Multiple biopsies were analysed from four tumours. The results for these specimens are shown in Table 6:3. Least variation was seen in the ploidy profile in these tumours.
6:3:7. Clinical outcome.
Insufficient time has elapsed to report the relationship of the kinetic data to clinical outcome. Patients are undergoing careful and regular follow-up for future assessment.
6:4. Discussion
The BRdU/FCM technique is not so effective in the study of carcinoma of the breast as with gastrointestinal tumours. BRdU labelling of tumour cells is clearly demonstrated by histochemical staining. Despite experiments with varying concentrations of pepsin, and of varying time exposure, it was only possible to obtain histograms suitable for full analysis including the S Phase duration and Tpot in 15 of 41 primary tumours and seven of 10 node metastases. Measurement of the DNA Index was possible in 28 of 41 tumours and of the labelling index, either corrected or uncorrected in 33 of 41 tumours. The majority of tumours were demonstrably labelled with BRdU. Failure was principally due to excessive DNA disruption yielding very broad G1 and G2 peaks which could not be analysed according to the algorithms previously described. The reasons for the resistance of these tumours to disaggregation in the conditions which are highly successful for gastro-intestinal tumours are not entirely clear. It is likely to be in part due to the high fat content and in part to the schirrhous nature of these tumours. Unfortunately, the breast tumour cells appear to be highly sensitive to overdigestion in the very conditions which are necessary to disrupt the connective tissue matrix. Some improvement in the preparation of suspensions was achieved by addition of the detergents Triton X-100 or Tween 20 during the pepsin digestion phase. McDivitt (1984) has reported a method for dissociation of viable human breast cancer cells that produce flow cytometric kinetic information similar to that obtained by thymidine labelling using prior incubation of tumour with Type IV Collagenase 5mg/ml in Hank’s balanced salt solution with 10% FCS at 37°C.
Does the data obtained by multiparameter FCM offer advantages in the study of breast tumour proliferation? Data obtained in this study may be subdivided into those data which can be obtained by methods other than in vivo labelling with BRdU, that is the DNA (Ploidy) Index, the S Phase Fraction and the Total Labelling Index, and those which are unique to the
A number of studies of ploidy in archival breast tumours in relation to prognosis have been reported. Flow cytometry of archival specimens yields data on the ploidy index and the S phase fraction. Breast tumours are diploid or aneuploid. Aneuploid tumours may have single or multiple abnormal cell lines, in which case they are polyploid. Diploid populations are composed of both normal proliferating cells (eg duct cells, lymphocytes) and tumour cells. Moran (1984) reported the ploidy of a series of breast lesions in which all 21 benign lesions were diploid, whereas 68 of 76 malignant tumours were aneuploid. The range of the SPF was less than 1.0% to 37.4%. McDivitt 1986 reported that 75 of 168 tumours in his series were diploid. Both studies also concluded that there was a good correlation between poor cytological differentiation and a high SPF, but clinical follow-up was not reported. Hedley (1987) reported the association between DNA index and S phase fraction and prognosis of 490 node positive early breast cancers. An SPF greater than 10% was associated with a shorter disease-free survival, but it was concluded that recommendations on clinical application were inappropriate owing to technical limitations in their flow cytometric method. Toikkanen (1989) reported a study of the prognostic significance of nuclear DNA content in 351 archival invasive breast cancers with long term follow-up of at least 22 years. Patients with diploid tumours had a better prognosis than patients with aneuploid tumours. The S phase fraction had prognostic significance in both node positive and negative groups. The DNA index was only significant prognostically in node negative patients, particularly in postmenopausal women. An interpretable DNA histogram could not be obtained from a further 46 tumours.
Caution must be used in the interpretation of such data, because of technical problems.
- Disaggregation of formalin fixed, wax embedded specimens into constituent nuclei is difficult to achieve without the introduction of artifacts. Thus, diploid tumours may be inadvertently described as aneuploid because of peaks introduced by debris.
- It is not possible in practice to distinguish normal and stromal nuclei from tumour nuclei in the diploid peak.
- The overlap of diploid and aneuploid S phases renders interpretation difficult.
Hedley et al (1987) were able to estimate the S phase fraction confidently in only 60% of 490 breast tumours studied. The SPF of breast tumours in that series was calculated to be 2.4-4.9%. Advantages have been demonstrated in using 70% ethanol or methylated ethanol as a fixative for gastrointestinal tumours, in which a histogram suitable for ploidy analysis was obtained for all tumours. These benefits were not demonstrated in this series of breast tumours, where the yield of satisfactory ploidy data was only 70%. In the measurable tumours, the proportion of diploid to aneuploid tumours correlates well with other series at approximately 50%.
How does the BRdU/FCM data compare with other markers of proliferation? Similarities are found between the reported values of the labelling index in human breast carcinoma regardless of whether in vitro or in vivo 3H-Thy or BRdU labelling has been used. Meyer et al (1989) compared in vitro labelling of 29 freshly excised primary breast tumour cells with BRdU and 3H-Thy. The labelling indices obtained by both methods were equivalent. The BRdU LI also correlated with the SPF measured by flow cytometry. In vitro BRdU labelling was concluded to be a simpler and more rapid technique than 3H-Thy labelling.
The mean and range of the total labelling indices in this series correlates closely with previously published data. There would appear to be little practical benefit in using the in vivo BRdU method in breast cancer simply to obtain a total labelling index. As was the case with gastrointestinal tumours, the case for the BRdU/FCM technique rests with the dynamic Ts and Tpot data. In the small series of 15 satisfactorily analysed tumours this is as yet unproven. A larger series of tumours and further modifications to the disaggregation technique will be necessary. For these reasons, the answer to the question as to whether the data have prognostic uses remains to be established.
A possible valuable application of the FCM/BRdU method in measuring breast tumour cell kinetics is in the field of therapeutic assay. Bontenbal (1989) studied the effect of pre-treatment with Doxorubicin on BRdU uptake in vitro into the MCF-7 cultured breast carcinoma cell line. Cells were pretreated with oestradiol and/or insulin to provoke entry into the S phase. Doxorubicin caused the accumulation of cells in late S/G2M. The method appears suitable for studying the interaction of hormones and chemotherapy on cultured tumour cell growth and may form the basis for a bioassay of drug action without the need for experimental animals. Whether the model will be adaptable to the in vivo clinical testing of drugs has yet to be established.
Appendix 6:A.
FCM data for cases described in this chapter.
CHAPTER 7
In vivo proliferation of other human tumours.
7:1. Introduction.
In this short chapter preliminary studies will be presented on the in vivo cell kinetics of a spectrum of tumours of clinical importance. These studies were undertaken to assess the usefulness of the BRdU/FCM technique for these tumours in advance of more detailed studies, and to determine the range of kinetic variation which might occur between pathological classes. Results obtained from the study of colorectal and gastro-oesophageal adenocarcinomas and mucosa have suggested that tumour cell kinetic data may be similar in different tissues of origin. It is of interest to establish whether the duration of the cell cycle phases as measured by BRdU incorporation are specific to tissues, tumour or organs from different embryological origins. This question has been addressed from a combination of sources. Firstly, original work was performed to study 10 urological tumours, 10 malignant melanomas and a small number of sarcomas, lymphomas, ovarian and squamous carcinomas. Secondly, these results were pooled with published and unpublished data selected from some 200 tumour biopsies labelled with BRdU at Mount Vernon Hospital (MVH) and analysed at the Gray Laboratory by other researchers. Thirdly, the international literature was reviewed for other related data.
Meyer (1982) reviewed a large series of tumours both from published series and from his own laboratory in which the in vitro thymidine labelling index had been calculated. Although the number of tumours in many instances was small, clear differences in the proliferative activity were seen from one pathological type to another (Table 7:1.).
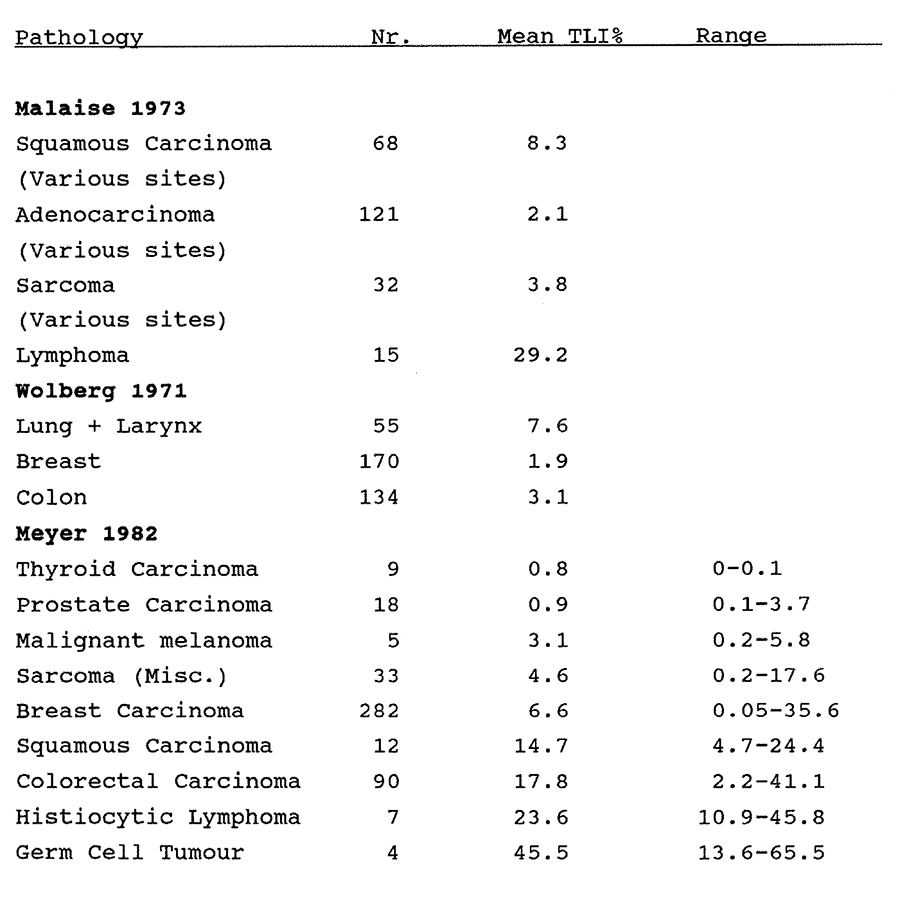
Table 7:1. In vitro Thymidine Labelling Indices of a variety of tumours, after Malaise (1973), Wolberg (1971) and Meyer (1982).
Tannock (1978) reviewed 97 studies in which the mean Ts and the mean Tc were calculated in a variety of tumours (including breast, colon, skin, brain and lymphoma) by the Percent Labelled Mitosis or the Double Labelling techniques. In all cases the mean Ts ranged from five to 28 hours and the mean Tc from 1.0 to 5.0 days.
In preliminary in vivo studies in seven human patients, Wilson et al (1985) measured the labelling index of three tumours following an injection of 500mgm of BRdU. Wilson, McNally et al (1988) performed FCM/BRdU kinetic measurements on a range of human primary and secondary solid tumours, including melanomas, head and neck, lung and rectal tumours. In 26 evaluable patients, they found that 38% of tumours had a Tpot of five days or less, and that there was no relationship between proliferation and histopathological differentiation, or DNA ploidy. In the following sections, cell kinetic data derived by in vivo labelling of a variety of human tumours with BRdU will be described.
7:2. The brain and central nervous system.
Hoshino et al (1985) studied 18 patients with brain tumours to whom BRdU was administered by infusion peroperatively. They obtained Labelling Index (S phase fraction) measurements which were compatible with isotope studies. They subsequently reported the BRdU labelling index of 182 human intracranial gliomas and on the prognostic implications. The median LI of 49 glioblastoma multiforme tumours was 7.3%, range 1.3-26.1%. The median LI of 36 highly anaplastic astrocytomas was 2.7%, range 0-38.1%, and of 42 moderately anaplastic astrocytomas was less than 1.0%, range 0-8.3%. A similar pattern was seen in 55 recurrent gliomas of all types. The median LI also tended to increase with age. They concluded that the BRdU LI reflects proliferative potential better than histo-pathological description, and that it is therefore a better indicator of prognosis and determinant of treatment.
Using FCM/BRdU, Riccardi et al (1988) reported that the mean LI of 22 meningiomas was 2.1% (Range 0.9-3.9%) and of 10 gliomas was 6.3% (Range 2.0-7.6%). The Ts and Tpot of one meningioma (Ts 16.7 hours, Tpot 63.2 days) and 10 gliomas (Ts 15.3 hours, range 10.0-22.7 hours; Tpot 13.4 days, range 4.6-63.2 days) were successfully measured.
7:3. Squamous carcinomas of the head and neck.
The importance of radiotherapy in the treatment of head and neck carcinoma has made these tumours particularly suitable for the study of kinetic data for therapeutic planning. In a multivariate analysis of prognostic factors in 86 cases of head and neck carcinoma, Chauvel et al (1989) showed that a higher thymidine labelling index was associated with a poorer prognosis. The value of ploidy measurements as prognostic indicators are unknown. Farrar et al (1989) reported no significant difference in tumour recurrence rates in 13 of 27 aneuploid and 14 of 27 diploid squamous cell carcinomas of the tongue.
Patients and results.
There were 13 carcinomas of the tongue studied at MVH. Three tumours were recurrent, two of which had previously undergone radiotherapy. Five tumours were aneuploid. The mean total labelling index of all tumours was 4.4% (range 1.8-9.4%). The mean aneuploid labelling index of five tumours was 10.6% (6.9-15.3%). The mean Tpot was 6.9 days (2.7-16.3 days).
7:4. Adenocarcinoma of the lung.
Tada et al (1986) labelled in vitro 27 surgically removed human lung carcinomas with BrdU. Adenocarcinomas had a significantly lower LI than squamous tumours (6.0% versus 17.2%). A trend was detected towards a higher LI in poorly differentiated adenocarcinomas. Shimosato et al (1989) reported the LI of 52 surgically removed human lung carcinomas labelled in vitro with BrdU. The LI of small cell carcinoma was 19.0% (range 17.9-19.8%), of squamous carcinoma was 11.0% (7.8-15.4%) and of adenocarcinoma was 3.6% (0.1-19.2%). Again, a trend was detected towards a higher LI in poorly differentiated tumours.
Patients and results
There were 13 patients with cutaneous metastases from carcinomas of the lung. Nine tumours were aneuploid. The mean total labelling index of all tumours was 5.3% (1.6-14.7%). The mean aneuploid labelling index of nine tumours was 10.4% (5.4-21.6%). The mean Tpot was 9.3 days (4.6-17.0 days). One further diploid tumour, a carcinoid, had a total LI of 0.3% and a Tpot of 176.7 days.
7:5. Malignant melanoma
In a retrospective flow cytometric study, Roenn et al (1986) found that there was a significant relationship between DNA abnormalities in primary malignant melanoma and naevi and conventional prognostic indices such as tumour depth. None of the 21 Levels I-III tumours were aneuploid, whereas 13 of 32 level IV-V tumours were aneuploid. Nine of 10 of the latter tumours had recurred within two years compared with four of 23 in the diploid group. Jacobsen et al (1988) demonstrated that analysis of primary and metastatic melanoma was possible in both fresh and wax embedded specimens with a strong correlation of results.
Patients and results
There were 15 patients studied in the MVH/St Mary's Hospital series, including one on two occasions and one on four occasions. There were five primary lesions (four cutaneous, one rectal) and 16 biopsies of node metastases. One primary and one secondary tumour yielded no data. The mean LI of the four primary tumours was 2.4% (range 1.2-3.8%) and of 16 metastases was 5.7% (2.1-11.9%). The nodal data may be distorted by the presence of labelled lymphocytes, thus giving a high LI. Two primary lesions were diploid and two were aneuploid (1.14, 1.60). The mean aneuploid LI of 10 metastases was 6.6% (3.4-12.2%). The mean Tpot of the four primary lesions was 13.0 days (3.3-22.0 days) and of 13 measurable metastases was 6.0 days (3.4-10.8 days).
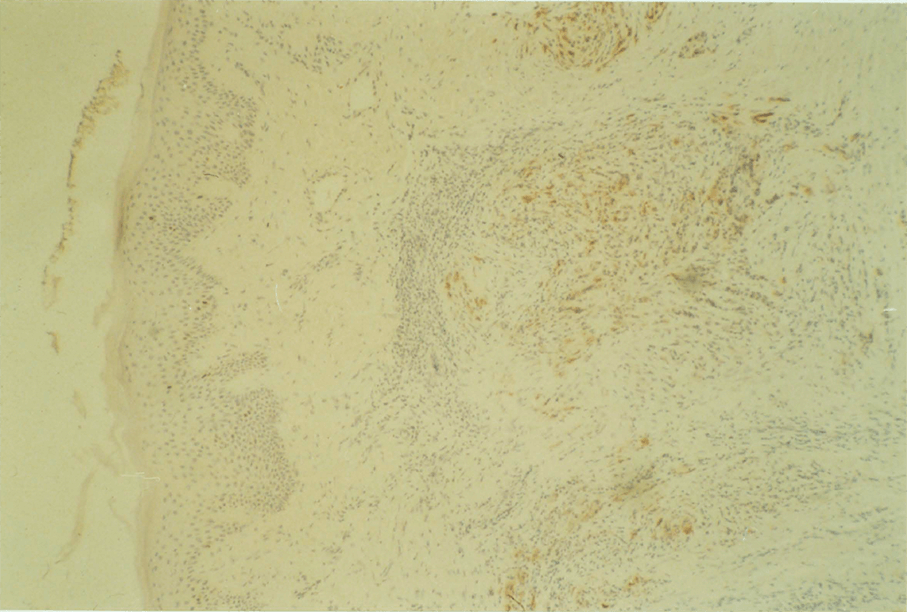
Figure 7:1. A metastatic deposit of cutaneous malignant melanoma (MEL004). S phase cells labelled with BRdU are stained with peroxidase. The FCM labelling index was 2.1%.
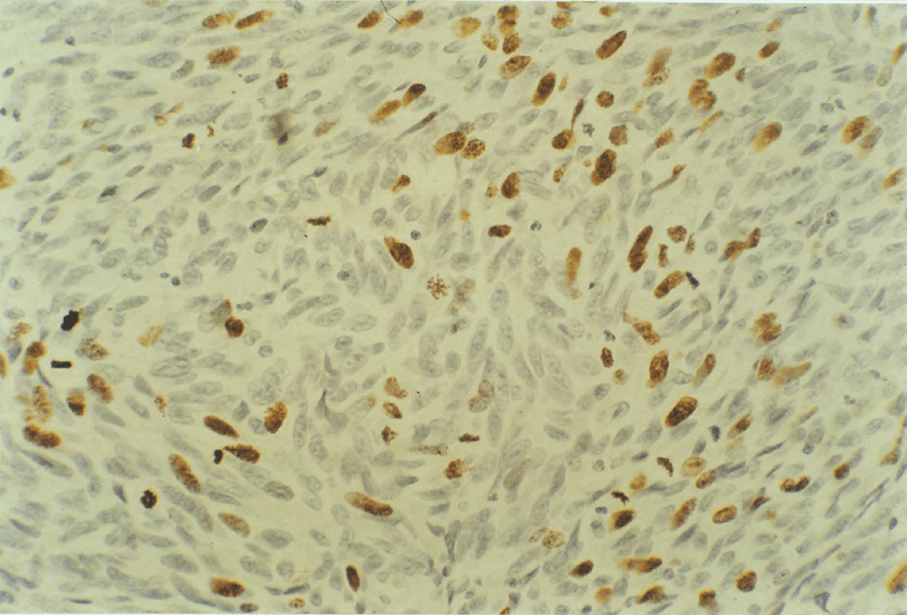
Figure 7:2. BRdU labelled cells in a primary rectal malignant melanoma (MEL001) stained with peroxidase. The FCM labelling index was 2.4% (Magnification X 40).
7:6. Transitional cell carcinoma of the bladder.
Retrospective surveys of the relationship between ploidy and prognosis of urological tumours have been reported. For example, Frankfurt (1986), in a study of 45 prostatic carcinomas, observed that 7.1% of well differentiated, diploid tumours metastasised, whereas 80% of poorly differentiated, aneuploid tumours metastasised. Findings were less clear-cut in the 78 patients with bladder carcinoma which they studied. Coon et al (1986) found that ploidy analysis of deparaffinised nuclei from 26 of 30 urinary bladder carcinomas correlated well with cytogenetic analysis as predictors of biological behaviour. 88% of specimens studied yielded analysable histograms. The in vivo use of BRdU to measure the labelling index of urological tumours of the renal pelvis, ureter, bladder and prostate by standard immunohistochemistry has been reported (Nemoto 1988, 1989.a, 1989.b). The use of multiparameter flow cytometry to study human urological tumour kinetics has not previously been assessed. In this section a preliminary study to evaluate the method in the measurement of the kinetics of transitional cell carcinoma of the bladder (TCCB) is described.
Materials and methods.
There were 10 patients with T1 TCCBs who consented to an intravenous bolus dose of 250mg BRdU between three and four hours before conventional transurethral tumour resection. Tumour specimens were preserved in 70% ethanol. Specimens proved to be very sensitive to digestion and 2M HCl denaturation. Further processing and data analysis were as described in Chapter 2. 10,000 nuclei per specimen were analysed. The TCCB is a good model for the study of tumour cell kinetics and the validation of flow cytometric and mathematical models of cell proliferation. It is readily accessible and the fully excised tumour volume can be measured by volumetric methods. The rate of cell exfoliation can be quantitated in the urine. Good clinical practice mandates regular reinspection and recurrences are sufficiently frequent to make direct comparisons between calculated and measured growth rates a practical proposition. Further studies are indicated to assess whether tumours can be identified which are likely to progress to deep invasion. At this stage, kinetic data may assist in the planning of optimum radiotherapy treatment regimes and in modelling improved chemotherapy for advanced disease.
Results.
Eight out of 10 tumours yielded an analysable DNA profile. One tumour was aneuploid, DI = 1.89. BRdU uptake was detected in all tumours. The median LI was 2.5%, range 0.3-4.6%. In four tumours the profile was satisfactory for calculation of the Ts and Tpot. The Tpots were calculated to be 7.0, 7.7, 12.6 and 48.0 days in these tumours.
7:7. Lymphomas.
Witzig et al (1989) described a slide based immunofluorescence method to measure the in vitro BRdU labelling index of 217 Non Hodgkins Lymphomas (NHL). The median BRdU LI of low grade NHLs was 0.9%, of medium grade NHLs was 7.5%, of high grade NHLs was 10.4% and of T-cell NHLs was 2.2%.
Patients and results.
The kinetic data for the seven patients studied in the MVH/SMH series are shown in Table 7:2.
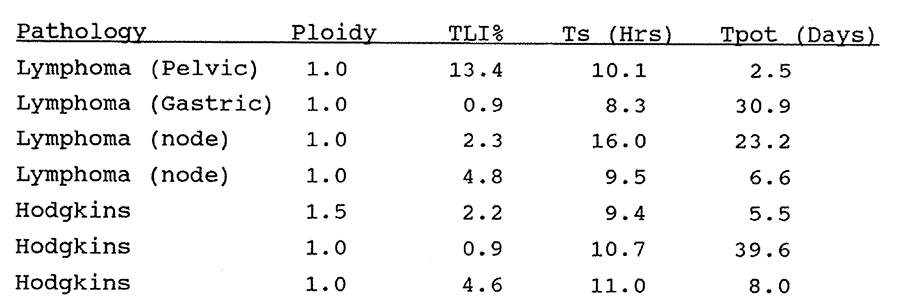
Table 7:2. Data from seven lymphomas.
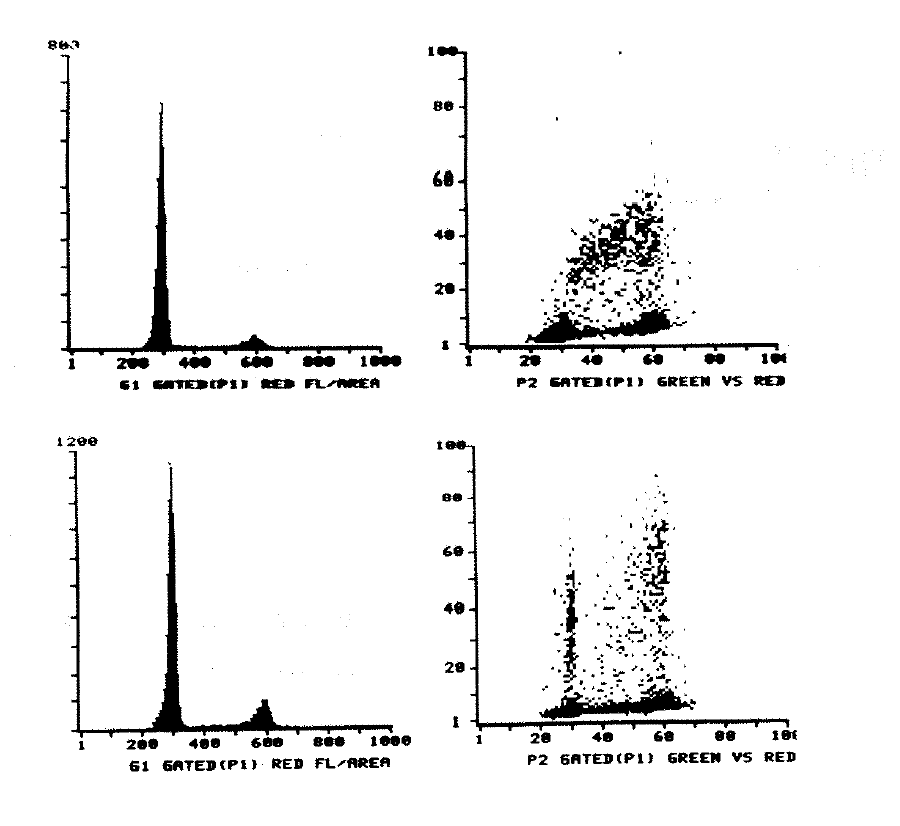
Figure 7:3. Histograms of a Basal cell carcinoma (upper) and a Squamous cell carcinoma (lower). Data in Table 7:4.
7:8. Other tumours.
A small number of other tumours were studied. Examples are shown in Figure 7:3. The low proliferative activity of sarcomas is noteworthy. Kinetic results are shown in Table 7:4.
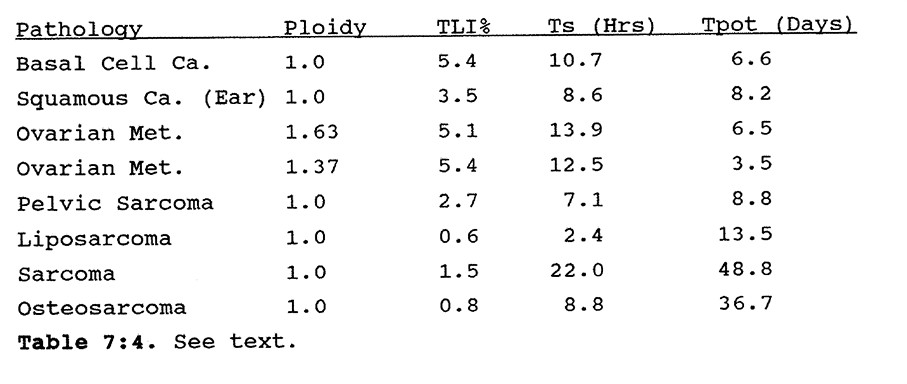
Table 7:4. See text.
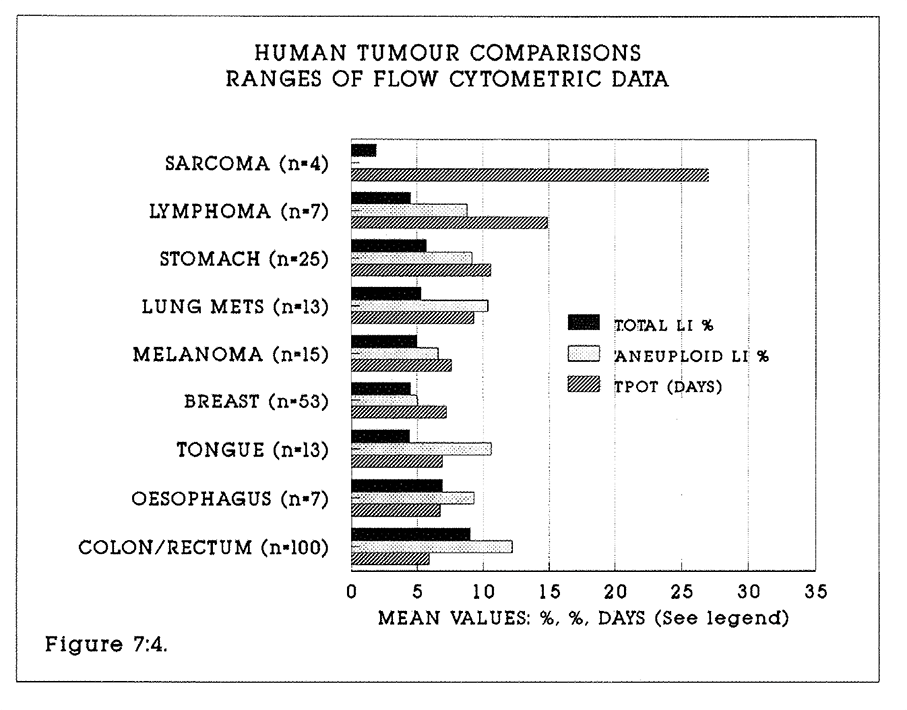
Figure 7:4. The histogram bars represent the mean values of the data. Shown are the Total Labelling Index, the Aneuploid Labelling Index (where measured) and the Tpot (days) of tumours in the series described in the text. Standard error bars have been excluded.
7:9. Chapter conclusions.
This chapter has reviewed the in vivo BRdU labelling kinetics of a number of different tumours. BRdU uptake after in vivo pulse labelling is a feature of all tissues and tumours studied. The in vivo labelling indices are similar to data obtained from in vitro labelling techniques. The feasibility of measuring the Ts and Tpot has been established in all tumours studied, but only small numbers of cases have been studied and the duration of follow-up is short. The value of the data in planning treatment strategies has yet to be established.
CHAPTER 8.
The c-myc gene product in colorectal tissues and tumours.
Chapter abstract.
C-myc gene expression is known to be increased in colorectal cancer. The p62 protein product is believed to be associated with proliferating tumour cells. The p62c-myc content was measured by multiparameter flow cytometry in tissue blocks of tumours, adenomas and mucosa from 94 patients. The BRdU labelling and cell kinetics of these tissue blocks were known. The study was undertaken to compare p62c-myc and BRdU labelling data as prognostic markers. Four interesting findings emerged. Firstly, the p62c-myc content of all tissues increases through the cell cycle, which implies that it is closely associated with nuclear DNA content. Secondly, levels of p62c-myc are as high or higher in normal mucosa than in tumours, which puts in doubt the definition of c-myc as an oncogene. Thirdly, no differences in c-myc expression were found in relation to histological grade of the tumour, contrary to earlier reports. Fourthly, the highest levels of p62c-myc were found in a small series of polyposis coli mucosa samples. This finding is as yet unexplained.
8:1:1. Introduction.
The existence of measurable intrinsic cellular markers of proliferation such as Ki67 has previously been discussed. It is possible that a reliable intrinsic marker of proliferation could be used as an indicator of the rate of cell proliferation in clinical practice. Such a marker would have advantages over BRdU. The c-myc gene product is increased in proliferating cells. The finding of altered c-myc expression with colorectal carcinoma has been reported. In this chapter the measurement of c-myc expression in colorectal tumours previously labelled with BRdU and therefore of known proliferative activity is reported, and the two measures of proliferation are compared.
8:1:2. Oncogenes in the control of the cell cycle.
Genes and complementary DNA fragments have been identified which are preferentially expressed in one or other phase of the cell cycle (Baserga 1986). These genes may also be identified by the appearance of complementary mRNA or protein product in cell cytoplasm, by techniques which include the microinjection of genes such as the v-ras and c-myc genes from transforming DNA viruses, and their protein products, directly into G0 and G1 cells. Monoclonal antibodies to transformation related products such as the p53 transforming protein may also be micro-injected. Other studies have used temperature-sensitive (ts) mutants, or the systematic analysis of complementary DNA gene libraries derived from G1 cells. Such studies may identify the specific factors which control the malignant cell cycle.
Oncogenes are genes which code proteins which are found in greater amounts in malignant cells (Bishop 1982, Watson 1986). More than 25 oncogenes have now been identified. Many are highly conserved regions of the normal human genome. Some bona fide oncogenes are expressed in a cell cycle dependent manner (Denhardt 1986). In general, the evidence relating oncogene expression to specific function in the cell cycle is circumstantial. Examples of such genes include the oncogene c-sis, which codes for a subunit of Platelet Derived Growth Factor (PDGF), v-erb-B which codes for the internal domain of the Epidermal Growth Factor Receptor (EGFR) and the oncogene c-fos which produces a 55,000 MW nuclear phosphoprotein. C-fos can be induced in G0 lymphocytes by platelet derived growth factor. The c-ras oncogene produces a 21000 MW protein, p21, which is highly conserved between species and is found in association with a number of human tumours. The protein is located on the inner surface of the cell membrane but its role is not understood. Vogelstein et al (1988) analysed 172 colorectal tumours and reported that activation of the c-ras oncogene combined with the loss of fragments of chromosomes 5, 17 and 18 may be compatible with a model of colorectal tumour genesis.
The p53 oncogene product is elevated in many tumours. Normal p53 function is not understood, but active p53 expression appears to be essential in the malignant transformation of tumour cells. The p53 gene is located on chromosome 17. Van den Berg (1989) demonstrated the immuno-histochemical expression of p53 in 8% of colonic adenomas and 55% of colonic tumours. He proposed that p53 may contribute to the process of malignant change in dysplastic polyps. The P53 and also the C-FOS and C-MYB (as distinct from c-myc) gene products are nuclear binding. Interferons, which modulate the proliferation and differentiation of cells in culture, may also modulate the expression of oncogenes such as c-myc and c-ras in tumours such as Burkitt lymphoma by acting as "negative growth factors" (Clemens 1987). Ras oncogene expression may vary between primary tumours and metastases (Eccles 1989).
The selective expression of an oncogene in the cell cycle does not necessarily indicate that it has a regulatory role. Calabretta (1985) reported the expression of c-myc and other cell cycle dependent genes such as the Histone-3 gene in human colon neoplasia, and concluded that an increased expression of an oncogene may simply reflect the increased fraction of cycling cells, unless the ratio of expression between G1 and G1-S phase genes is altered.
Multiparameter flow cytometry has been used to measure expression of other cell cycle related oncogenes. For example, Czerniak et al (1987), studied the expression of Ha-ras oncogene p21 protein in relation to the cell cycle of cultured human tumour cells. They showed that the level of p21 increased rapidly in the late G1 (G1B) phase and remained elevated until mitosis. p21 was identified by the specific monoclonal IgG2a isotype.
8:1:3. The C-MYC gene.
C-myc is a normal cellular gene. C-myc shows differential expression between resting and proliferating cells and is highly conserved between species (Studzinski 1986). Its gene product is a 439-amino acid, 62,000 MW phosphoprotein (p62c-myc) whose structure and function have been described. The protein has been associated with the Leucine Zipper hypothesis of protein binding to DNA (Dang, 1989). C-myc RNA increases in cells stimulated to division. C-myc can be detected by flow cytometry of formalin fixed specimens using a monoclonal antibody against p62c-myc such as 6E10, and by various DNA hybridisation techniques. The p62c-myc protein product is a nuclear antigen which is stable when preserved in 70% ethanol and is measurable after tissue disaggregation by pepsin digestion. Karn (1989) has amplified upon the role of c-myc in the control of the cell cycle in an experimental model. Murine fibroblasts were infected with c-myc carrying retroviruses. It was shown that c-myc levels are rate limiting for G1. Moreover, in this model the length of G1 varies in proportion to exogenous c-myc expression.
8:1:4. C-MYC expression in malignant states.
The myc family of genes includes the functional members B-, C-, L- and N- (Ingvarsson 1988). The N-myc gene is an abnormal variant which is amplified up to 300 times in neuroblastomas. The normal gene is sited on chromosome 8 at location q24, and is translocated and abnormally but variably expressed in Burkitt’s Lymphoma, in association with a region of immunoglobulin expression (Taub 1984). It may have clinical significance as a prognostic indicator for testicular tumours (Watson et al 1986) and for colonic tumours (Sikora 1987) when measured by Western blotting. It appears to be expressed more abundantly in well differentiated teratomas. In malignant B-cell lymphomas, levels of c-myc protein as analysed by flow cytometry and a polyclonal anti c-myc antibody correlate with cell growth potential.
8:1:5. The c-myc Oncogene in human colon neoplasia.
Colorectal carcinomas often express raised c-myc mRNA levels in the absence of detectable change at the c-myc gene locus. Erisman et al (1989) have provided evidence that deregulation and hence overexpression of c-myc is often associated with loss of allelic markers on chromosome 5q, which is also known to contain the gene "apc" associated with familial adenomatous polyposis (FAP), as may be chromosomes 17p and 18q. Dunlop et al (1990) have shown that loss of both alleles commonly occurs in colorectal tumourigenesis, whereas FAP polyps develop in the heterozygous state. Imaseki et al (1989) found that c-myc transcript levels by Northern blot analysis were high in colorectal polyps, tumours and metastases, but not in gastric carcinoma.
Evidence contradicting this view is provided by Dolcetti et al (1988), who found by DNA hybridisation that only one of 44 colorectal tumours showed overexpression of c-myc. N-myc, L-myc, c-myb and p53 expression were also unchanged.
The c-myc protein can be detected by immunoperoxidase staining of thin sections, by molecular probe methods such as Western Blotting or by bivariate flow cytometry. Watson et al (1986) measured the expression of p62c-myc in colonic polyps and tumours by flow cytometry (FCM) and found that p62c-myc is less well expressed in poorly differentiated colorectal tumours. FCM has the advantage over Western blotting of being able to discriminate between subsets in heterogenous populations using DNA content as a second parameter (Watson JV 1987).
8:1:6. C-MYC expression in colorectal adenomas, polyps and mucosa.
Watson et al (1987) studied the distribution of immuno-peroxidase staining of p62c-myc with the 6E10 monoclonal antibody in 42 archival colonic carcinomas, 24 benign polyps and 15 normal mucosal biopsies. They concluded from the distribution of staining in their sections that the gene product may have a role in the evolution of colonic neoplasia (Stewart 1986). The staining pattern of polyps from 18 cases of polyposis coli was compared with 30 normal control colonic biopsies. The polyps showed a more hetero- genous distribution of staining than normal tissue. Finley et al (1989) found that c-myc mRNA but not N-myc or L-myc mRNA was significantly over-expressed in colorectal adenomas and tumours compared with normal mucosa. Constantini et al (1989) found a wide variation in c-myc mRNA expression within tumours and adenomas by in situ hybridisation.
Watson et al (1987) showed that c-myc is expressed in archival specimens of colorectal mucosa, at significantly higher levels in tissue from patients with colorectal carcinomas. In both groups the level of p62c-myc increases through the cell cycle. Ten-Kate et al (1989) studied c-myc expression in normal human colon epithelium by in situ hybridisation and by histochemistry. They found that p62c-myc was expressed throughout the thickness of the epithelium and not preferentially in any one compartment.
Studies of p62c-myc have demonstrated its importance both as a possible marker of colorectal neoplastic proliferation and as a possible component of the mutation process. In this chapter, a prospective study of the expression of p62c-myc in colorectal tumours, polyps and mucosa is reported. The proliferation characteristics of this material as measured by BRDU incorporation were used for comparison.
8:2. Materials and methods
Tissue blocks of colorectal mucosa, polyps and tumours were selected from BRdU labelled material stored in 70% ethanol at minus 4°C. Tissue samples for p62c-myc measurement were obtained from within a few millimetres of the samples excised for BRdU studies in order to minimise sampling error. Nuclei were obtained by mechanical disaggregation, followed by incubation of the fragments in 8mls porcine pepsin (Sigma) solution in 0.1M HCl at a concentration of 0.1mg per ml for 45 minutes at 37°C while undergoing agitation. The resulting suspension was filtered through a 35 micron mesh and centrifuged at 1500 rpm for five minutes to select the nuclei. Nuclei were then washed twice in fresh Phosphate Buffered Saline (PBS). The concentration of nuclei was adjusted to approximately two million per ml. Each sample was aliquoted into two separate vials for primary antibody and fluorescence control measurements.
Incubation with Anti-p62c-myc monoclonal antibody
Nuclei were resuspended in 20 microlitres of 6E10 antibody (Cambridge Research Biochemicals) at 1 in 10 dilution. The production of this mouse monoclonal antibody raised against an 18 peptide sequence (residues 171-188) of human c-myc protein (Evan, 1985a, 1985b), and antibody specificity controls have been described (Watson 1986). The 6E10 antibody is believed to bind stoichiometrically to p62c-myc. Incubation proceeded for one hour at room temperature. Nuclei were then washed twice in PBS. The fluorescence control nuclei were resuspended in 20 microlitres of PBS.
Staining with rat anti-mouse antibody-FITC conjugate
All samples were washed twice in PBS and were resuspended in 20 microlitres of rat anti-mouse antibody-FITC conjugate (Sigma). Incubation again proceeded for one hour at room temperature. Nuclei were then washed twice in PBS. Nuclei were resuspended in 1.5ml Propidium Iodide (Sigma) solution (final concentration 0.025mg/ml) to counterstain DNA.
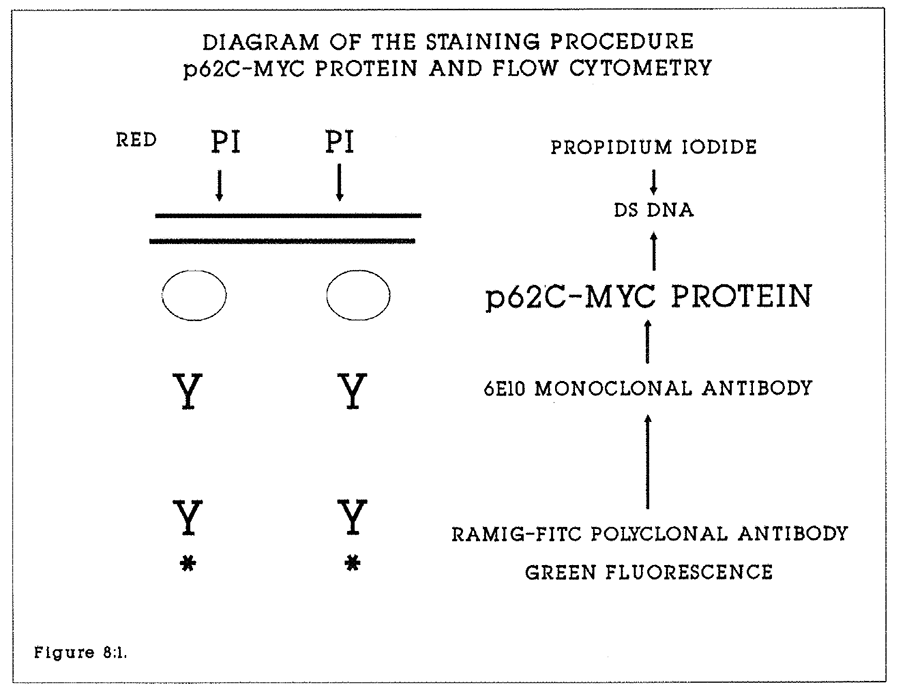
Figure 8:1. A stylised diagram of the staining procedure for nuclei prior to flow cytometric measurement of p62c-myc in relation to DNA content of extracted nuclei. DS DNA is double stranded DNA. RAMIG-FITC is fluorescein conjugated rat anti-mouse polyclonal immunoglobulin.
Flow cytometric data collection and analysis.
Analyses were carried out on the Cambridge MRC custom built dual laser flow cytometer using methodology as previously described by Watson et al (1987). An Innova 70-5W Argon ion laser (Coherent, Palo Alto, CA) was used to excite at 488nm light wavelength. Green fluorescent light (FITC) was collected at 510-560nm and red fluorescence (PI) above 620nm. Forward and 90 degree light scatter were also collected. All data on fluorescent events were collected by the Vax 8600 computer (DEC) in list mode. The data was gated to exclude multiple nuclei on the forward and 90 degree scatter signals (Sikora et al 1987). Data for 10,000 nuclei were collected.
from each specimen. Each analogue signal was digitised within a range of 1-1024. A rapid cell cycle algorithm was used to calculate the proportions of cells in the G1 diploid and aneuploid, S, and G2+M regions of the histograms (Watson, 1987). The green fluorescence p62c-myc distributions associated with each cell cycle phase were displayed, contour gated and the mean and median values were calculated. The mean and median p62c-myc content of each cell cycle phase in each tissue or tumour were calculated by subtracting the fluorescence control values from the "primary antibody" values. The results were expressed in arbitrary units in the range 1-1024 units. Resulting data was analysed in the groups described to calculate the mean, median and SEM values. Tissues expressing 50 units or less of p62c-myc were deemed not to have significant staining and were omitted from further analysis. The statistical significances of differences between the groups were analysed by one way analysis of variance.
8:3:1. Results.
Tissue blocks of tumours, adenomas and mucosa labelled with BRdU were studied for p62c-myc content from 94 patients. There were 26 normal mucosal specimens from terminal ileum and sites throughout the colorectum, seven specimens from two patients with polyposis coli, four specimens of villous adenomas, four well, 46 moderately and 24 poorly differentiated tumour specimens. A further 14 tumour specimens and seven mucosa/polyp specimens were analysed but did not express p62c-myc.
All mucosa and villous adenoma specimens were diploid. 29 of 74 successfully analysed tumour specimens were aneuploid. p62 c-myc expression increased universally through the cell cycle, such that the mean G2 fluorescence was up to twice that associated with the G1Diploid (G1D) peak. Data comparisons with the Total BRdU labelling index and the Tpot were based on the mean G2 p62 c-myc content. S phase nuclei expressed intermediate values between the G1D and G2D values.
8:3:2. Evidence for cell cycle related p62c-myc expression.
In all specimens studied in which p62c-myc levels were measurable, there was progressively higher expression between the G1D, G1 Aneuploid (where relevant), S and G2 phases of the cell cycle. p62c-myc content was compared in the G1D and G2D phases of 57 colorectal tumours in which the G2D p62c-myc content was at least 50 units. The mean G1D p62c-myc content was 152.2 +/- 14.2 units, (median 108 units, range 31.8-462 units) and the mean G2D p62c-myc content was 209.3 +/- 18.4 units (median 177.3 units, range 53-610 units). A significant difference existed between these values (Student t-test, p = 0.001). p62c-myc content in the G1An phase of aneuploid tumours was intermediate to this range of values.
In a further 17 specimens only the G2D values were measured. The mean values and the standard errors of the mean G2D p62c-myc content were calculated for the total of 74 tumour specimens with positive c-myc staining and are shown in Table 8:1. This value represents the peak protein expression in each specimen.
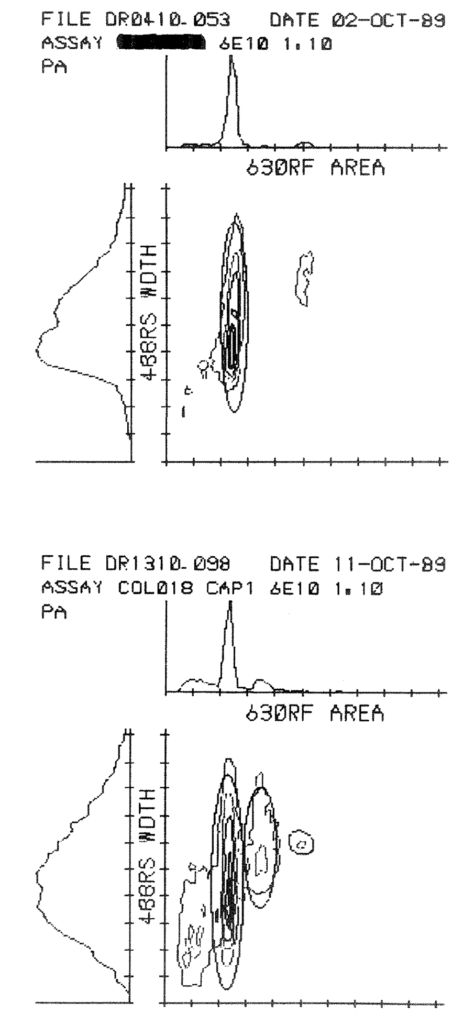
Figure 8:2. These histograms illustrate the analysis of p62c-myc content by multiparameter flow cytometry on the Cambridge purpose-built machine. Each histogram has three components. The left hand (488RS width scatter) plot reflects nuclear size. The top (630RF Area) ploidy histogram records the DNA content of the nuclei. Gating is set around regions of interest (G1 and G2 diploid and aneuploid populations). p62c-myc content is marked by contour lines and is in effect measured perpendicular to the plane of the page. The upper set of histograms were of a specimen of rectal mucosa (RCT048) and the lower set of histograms were of an aneuploid tumour. 10,000 events are displayed in each instance. The results of the analyses are given in Appendix 8:A.
A similar analysis was performed on 26 specimens of colorectal mucosa in which the G2D p62c-myc content was at least 50 units. In all cases the mucosa was obtained from patients with colorectal tumours. The mean mucosal G1D p62c-myc content was 227.1 +/- 20.1 units, (median 221 units, range 78-374 units) and the mean G2D p62c-myc content was 306.1 +/- 23.6 units (median 302 units, range 129-518 units). A significant difference existed between these values (Student t-test, p = 0.001).
These results indicate that there is a significant increase in p62c-myc content with cell cycle progression through both tumour and mucosal cell cycles, and that p62c-myc expression changes in a similar fashion through the cell cycle of mucosal and tumour cells. The measured increase is less than 100% through the cell cycle, but these findings support the hypothesis that p62c-myc synthesis is a marker of proliferation in the S phase.
8:3:3. Non-expression of C-MYC in colorectal tissue.
In 13 tumour specimens the mean G2D p62c-myc content was less than 50 units (range 0-34 units). No pattern was identified to account for these low measurements. Six of these tumours were diploid, and the BRdU labelling indices ranged from 4.0-28.2%. Three mucosa and three adenoma specimens expressed less than 50 units of p62c-myc. All were diploid, with labelling indices of 2.2-7.0%. It is possible that these are false rather than true negative results, for example caused by overdigestion of protein during nuclear extraction.
8:3:4. C-MYC expression and ploidy.
As was the case with BRdU labelling, the use of flow cytometry to measure p62c-myc allows the simultaneous measurement of DNA content by propidium iodide labelling. A G2D p62c-myc content of more than 50 units was measured in 45 diploid and 29 aneuploid tumours. The measurements were made on the G2D peaks of both diploid and aneuploid tumours.
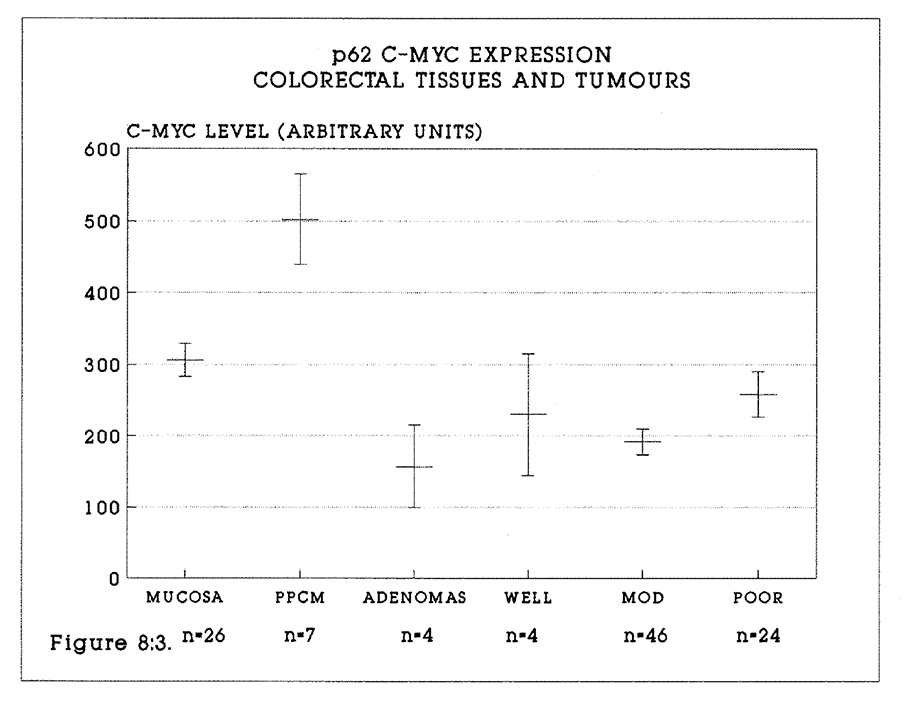
Figure 8:3. The mean p62c-myc content (+/- S.E.M.) of the colorectal tumours and tissues are shown. Specimens measured were colorectal mucosa, polyposis coli mucosa, villous adenomas, well, moderately and poorly differentiated tumours.
It was rarely possible to identify the G2 aneuploid peak in the aneuploid tumours. The mean G2D values were 214.4 units in diploid tumours and 217 units in aneuploid tumours. There was no significant difference by either parametric (Student t test) or nonparametric analysis (Mann Whitney test). This observation supports the hypothesis that p62c-myc protein may be a normal "structural" protein associated with DNA.
8:3:5. Expression of C-MYC in relation to histological grade of tumours.
There was no significant relationship between the p62c-myc content and the tumour grade of the four well, 46 moderately and 24 poorly differentiated tumour specimens (see Figure 8:3). In particular, the p62c-myc content of tumours of all grades is seen not to be increased compared with mucosa from tumour specimens. It is stressed that the data do not include specimens of mucosa from clinically normal bowel, and it is possible that the p62c-myc levels are higher in mucosa of tumour-containing bowel than in normal bowel mucosa. This observation will be tested in due course.
8:3:6. Expression of C-MYC in Polyposis Coli.
Seven mucosal specimens without macroscopic evidence of polyps and two adenoma specimens were studied from the two patients with polyposis coli. The mean G2D content of p62c-myc in the mucosal specimens was 502 units (range 168-639 units, median 587 units). This was significantly higher than the equivalent values in mucosa from colorectal tumour patients, (p = 0.01, Student t test).
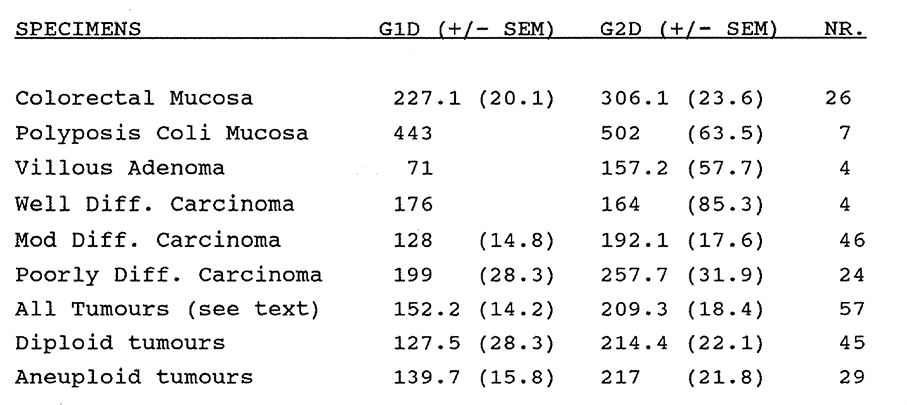
Table 8:1. The mean p62c-myc content of the G2Diploid peaks in colorectal tumours, adenomas and mucosa.
8:3:7. Comparison of C-MYC expression and the total BRdU labelling index.
BrdU LI and Tpot data had previously been calculated for all specimens in which the p62c-myc content was measured. The mean values and the Standard Errors of the Mean data for the BrdU LI and p62c-myc were plotted as shown in Figure 8:4. Data for the BrdU labelling index were derived directly from flow cytometry for both tumours and polyps, and mucosa. Corrections for crypt: stroma labelling as described in Chapter 3 have not been applied to the mucosa data.
The mean values and the Standard Errors of the Mean data for the BrdU derived Tpot and p62c-myc were plotted as shown in Figure 8:5. This serves to emphasise the observation that the more rapidly proliferating tumour cells in this series of specimens express intermediate levels of c-myc protein similar to those of colorectal mucosa.
8:3:8. Intra-tumour and intra-specimen variation in p62c-myc content.
It has not yet been established whether p62c-myc content varies through an individual tumour or tissue specimen. This question will be addressed in due course.
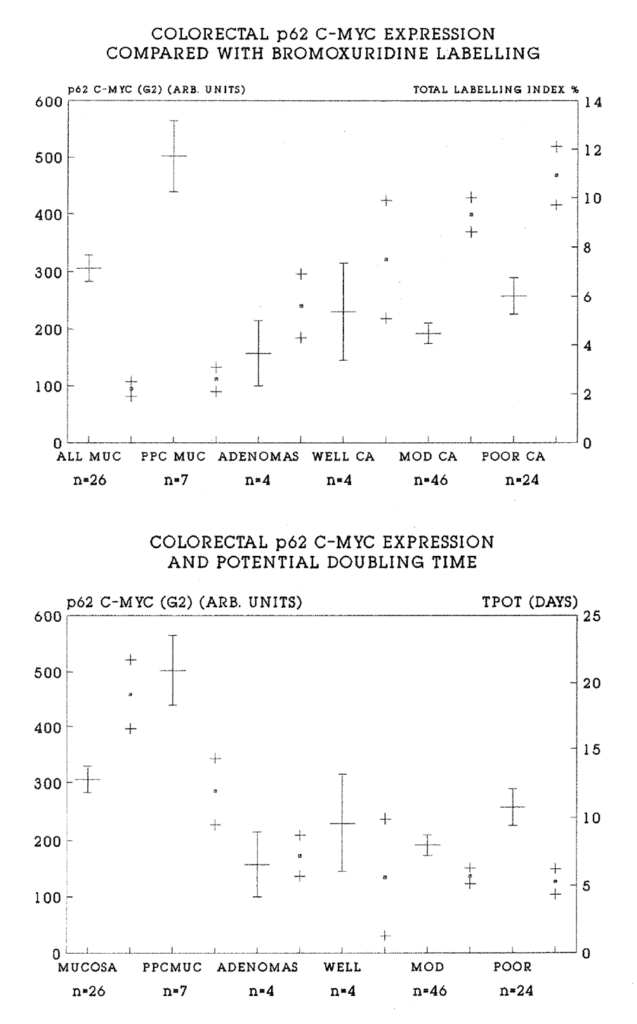
Figure 8:4. The data plotted in Figure 8:3. has been paired in each instance with the mean (.) +/- S.E.M. (+) total BRdU labelling index for the same tissue or tumour specimens. The LI range is shown on the Y2 axis. It is striking that there is a generally inverse relationship between the p62c-myc levels and BRdU labelling.
Figure 8:5. This is a similar plot to Figure 8:4. Tpot data, mean (.) and S.E.M. (+) has been paired with p62c-myc content from the same specimens. The range of Tpot values is shown on the Y2 axis. There is no clear pattern to the relationship between the Tpot, a dynamic measure of proliferation, and the p62c-myc content.
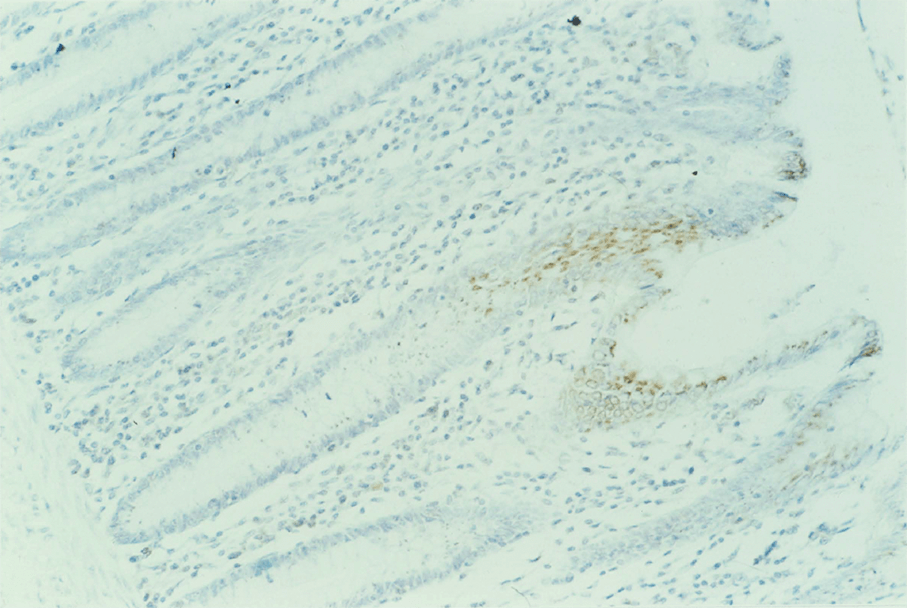
Figure 8:6.
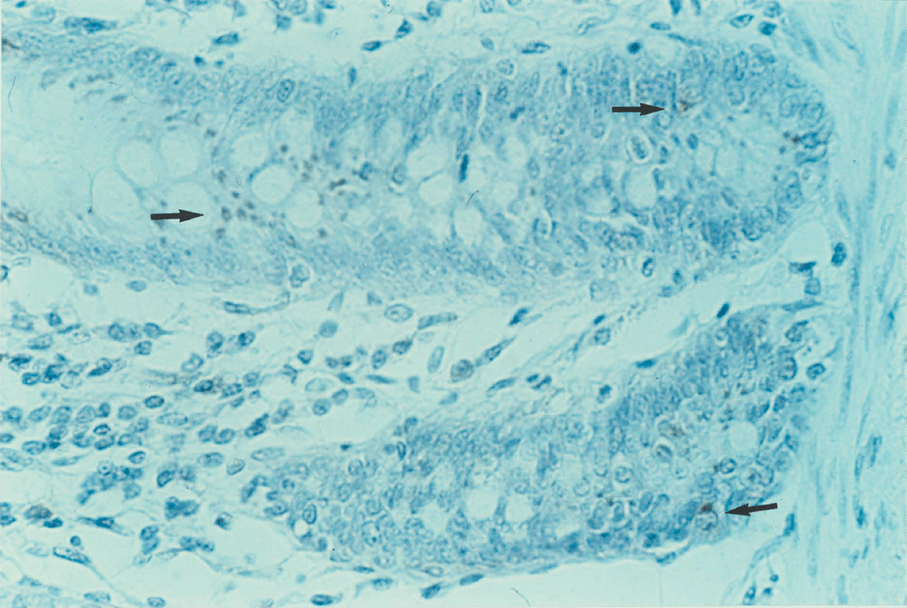
Figure 8:7.
Figures 8:6 and 8:7 are both sections of polyposis coli mucosa (P0L003) stained with peroxidase for p62c-myc. Surprisingly little nuclear staining is seen. Most stain is cytoplasmic. This phenomenon is not yet understood but has been reported previously (Stewart 1986).
8:4:1. Discussion of the methodology.
Efforts to understand the role played by the c-myc gene and its protein product in the process of DNA synthesis during proliferation have been complicated by the range of experimental techniques and cell models used. These variously have included the measurement of c-myc complementary DNA, mRNA and gene transcript levels by molecular Blotting techniques. The measurement of protein expression rather than gene expression has theoretical and practical advantages. Protein content is the end point of gene expression, and is the mechanism by which gene function is effected. It is therefore likely that the measurement of protein expression will provide the most useful indicator of changed gene function and expression, being the end point of all changes in gene regulation, transcription and translation.
Monoclonal antibodies raised against epitopes on gene protein products allow the study of tissue expression of the protein by both flow cytometry and immunohistochemistry. The former measures large numbers of nuclei in heterogenous populations, while the latter enables the tissue distribution of the protein to be studied. At the tissue level these methods offer considerable advantages over molecular biology techniques. The 6E10 antibody raised against a human p62c-myc epitope offers these advantages. Possible advantages and sources of experimental error arising in the preparation of solid tumour nuclei for flow cytometry have previously been discussed in relation to BRdU measurement. Similar considerations apply to the measurement of p62c-myc.
1. Fixation and preservation
The retrospective study of p62c-myc content in formalin fixed, paraffin embedded archival material is complicated by the process of fixation and the requirements of extraction. The use of 70% Ethanol or Methanol as a preservative for all specimens in this series appears to minimise the tissue disruption associated with formalin fixation (Feichter 1986).
2. Digestion.
The nuclear p62 protein is sensitive to pepsin digestion once cytoplasmic digestion has occurred. Nuclear suspensions were therefore prepared in pepsin concentrations of 0.05-0.1 mg/ml pepsin in 0.1M HCl over 30 minutes to one hour, as compared with 0.4 mg/ml for BRdU extraction. It is not possible to be certain as to how much epitope degradation occurs during this process, and it is possible that specimens with a low measured p62 protein content are false negative results. This problem has been illustrated by Lincoln and Bauer (1989), who have demonstrated discrepancies between c-myc expression as measured by immunohistochemistry and by flow cytometry. They found that p62c-myc levels in HeLa S3 cells were reduced by 50% following 0.5% pepsin treatment of de-paraffinised tissues.
8:4:2. Discussion of the data.
The results described address a number of hypotheses concerning the role of the c-myc gene in the processes of proliferation in normal and malignant colorectal tissues through the medium of measurement of its p62c-myc protein product by flow cytometry.
Firstly, there is strong evidence in this study to support previously reported evidence that c-myc gene expression is cell cycle related. The increase in p62c-myc content with cell cycle progression from G1 to G2 is found in all specimens studied, and suggests that the protein may be "structurally" associated with DNA. However, a simple doubling of protein content with chromosome duplication is not observed. This may reflect a partial digestion of p62 during nuclear extraction. Alternatively, it is possible that the comparison between the mean G1 and G2 protein content is misleading. It may be more appropriate to compare the early G1 protein content with the late G2 protein content, when a more precise doubling of protein content may be apparent. This concept also may apply to other genes coding for proliferation associated antigens.
Secondly, the relationship between c-myc expression in normal tissue and in colorectal adenocarcinomas does not appear to be that of a progressive increase of nuclear c-myc content with malignant transformation. Most importantly, the absolute levels of protein expressed in mucosa and tumour cells are similar (Figure 8:3) in each phase of the cell cycle, and in both aneuploid and diploid tumours. This implies that the c-myc gene may not be an oncogene (unlike the N-myc gene), but is simply the source of a DNA structural protein whose synthesis is inevitably increased during chromosome duplication, and whose absolute levels will be increased in aneuploid tumours in proportion to the abnormally increased DNA content. It is clearly important that no gene is designated as an oncogene until the expression of its product has been assessed in both the tumour and in its tissue of origin. Moreover, study of the expression of the gene itself (eg via the transcription or mRNA product) may lead to conclusions at odds with those derived from studying the (protein) product. In other words, no final conclusions about the nature of a gene should be drawn until it has been studied by a number of techniques, with emphasis on measurement of the (protein) product.
Thirdly, the data reported here does not support the hypothesis that p62c-myc is involved in the sequence of changes from mucosa through adenomas to frank carcinoma (Figure 8:3). The numbers of specimens studied in all categories are small with the exception of moderately differentiated adenocarcinomas, and further study with larger numbers of specimens may be necessary to draw firm conclusions. It is noteworthy that both adenomas and tumours of all grades show a trend to a lower p62c-myc content than their mucosa of origin, particularly in the case of polyposis coli. It is thus possible that the c-myc gene, far from being an oncogene, is a normal gene whose overall expression is impaired by malignant change, regardless of any changes in the absolute number of gene and transcriptional copies caused by altered gene control in the neoplastic state.
Fourthly, previously reported findings of different p62c-myc content according to histological grade are not supported in this study. However, this observation may in part be affected by different descriptive criteria employed in different reporting centres. Moreover, there are too few well differentiated tumours in this series for firm conclusions to be drawn.
Fifthly, the relationship between c-myc expression and cell proliferation in normal and abnormal cells as detected by BRdU incorporation is of considerable interest. A broadly inverse relationship is seen to exist between the proliferation of the tissue and its p62c-myc content. The mean p62c-myc content of cells expressing c-myc is not affected by the proliferative activity of the tissue, and is similar in both tumour and mucosal cells. In other words, G2 p62c-myc levels bear no relationship to the proportion of proliferating cells or the degree of malignancy of the tissue. This observation provides some evidence to support the hypothesis that p62c-myc is not an oncogene product, and that c-myc is functioning as a normal gene.
A striking but unexplained observation is the high absolute value of p62c-myc content in the mucosa of polyposis coli patients, which has a similar labelling index to "normal" mucosa. Although this is a small sample, this finding mandates further investigation for two reasons. It suggests that p62c-myc may be useful as a disease marker in polyposis coli. It may also provide further clues to the process of polyp development in polyposis coli. Of interest is that the small number of polyps studied do not show a value of p62c-myc content intermediate between mucosal and tumour levels.
Further questions remain to be addressed. Firstly, is the p62 c-myc content of normal colorectal mucosa the same as that of mucosa from patients with a colorectal adenocarcinoma? In other words, is there a field change in p62c-myc content of
mucosa associated with malignant change? Sundaresan et al (1987) reported that p62c-myc exhibited increased expression in archival normal mucosa specimens containing a carcinoma. They suggested that this observation may represent an early step in malignant transformation in which large areas of colonic mucosa become primed for subsequent focal transforming events. Support or rebuttal of hypothesis will be readily addressed by collecting (and preserving in 70% ethanol) normal mucosa from patients undergoing colonoscopy or rigid sigmoidoscopy for reasons other than the presence of malignancy.
Secondly, the finding of a significantly raised p62 protein content in the mucosa but not the polyps of patients with Familial Polyposis requires further investigation both for diagnostic or screening potential and for the light which it might shed on the neoplastic process.
Thirdly, what is the distribution of cells expressing c-myc in a tissue or tumour in relation to BRdU incorporation? This question may be addressed by immunohistochemical staining of tissue sections for both BRdU and p62c-myc. The relationship of p62c-myc content to clinical outcome will be studied once sufficient follow up has occurred. It is unlikely that p62c-myc measurement will prove to be a useful prognostic indicator given the similarity in the range of values of tumours of varying histological grade.
In conclusion, the studies reported in this chapter provide evidence that the cellular expression of the c-myc protein is highest in the G2 phase of the cell cycle of all proliferating cells. It is not related to the malignant potential of the cell, nor to the overall proliferative activity of the tissue or tumour. The c-myc gene should perhaps be classified as a normal cellular gene rather than as an oncogene.
Appendix 8:A. The data described in this chapter.
CHAPTER 9
Discussion. Cell kinetic data applied to therapy.
9:1. Introduction.
Steel (1977) observed the need to increase the study of animal and human tumour growth kinetics by autoradiographic techniques. He also stressed the need to elucidate the clonogenic theory of tumour growth. The FCM/BrdU method has enabled us to move beyond the limitations of radioisotopes to study human tumour and tissue kinetics in detail. It is now possible to make practical calculations of cell cycle parameters for individual human tissues and solid tumours of many histological types based on in vivo data. Kinetic data can be obtained rapidly, safely and easily, as compared with autoradiography. In general terms the "static" data on tumour and tissue kinetics measured in this study, that is the total labelling index, have proved to be similar to in vitro measurements with BrdU or 3H-Thymidine. The addition of the flow cytometer provides much more information.
- The ploidy and the S phase fraction can be measured.
- Much larger numbers of events can be counted than are practical with autoradiography.
- One or more extra parameters, such as BrdU or p62c-myc content can be measured.
- The relationship of any measurable parameter to the component phases of the cell cycle can be established (eg the aneuploid labelling index).
- Time dependent parameters such as the Ts and Tpot, and even the rate of enzyme kinetics (Watson 1987) can be measured.
The particular advantage of in vivo BrdU or IRdU labelling is to place a marker of S phase nuclei in the tissue against which other antigens can be measured by flow cytometry and immunohistochemistry. An example of this approach has been given in Chapter 8 with c-myc expression. Other proteins lend themselves to this approach, whether nuclear, cytoplasmic or membrane bound. The limitations are imposed by the availability of appropriate monoclonal antibodies and the disruption to membranes and cytoplasm caused by tissue disaggregation. Early candidates for future study include the proteins cyclin and spectrin (Ogata 1987).
The short term safety of low dose BrdU given as a single bolus is established. Although a mutagenic hazard has been stated, there is no clinical data to support this contention to date. Further applications of BrdU/FCM in clinical research might include the study of the kinetics of mucosa in inflammatory bowel or coeliac diseases, in which case BrdU should be used with caution and ethical approval in patients of reproductive age who intend to have further children. Even so, the relative hazard of BrdU compared with other drugs such as Azothiaprin is likely to be low.
9:2. Cell cycle kinetic data applied to therapy.
How might the knowledge derived from BrdU labelling in particular and from multiparameter flow cytometry in general be best applied to improving cancer treatment? Kinetic data will be most valuable if it can be put to therapeutic use. Much work has been published on the theory and application of cell cycle kinetic data to chemotherapy and radiotherapy regimes. As yet no known therapy will produce completely selective killing of tumour cells while preserving normal tissues. Fractionated scheduling of treatments (Norton 1979) to take advantage of differences in the proliferative rate of tumour and normal tissues is one approach to cancer therapy based on cell kinetics theory. Prior to the FCM/BrdU technique human tissue kinetic data have rarely been available and therapy regimes could not be properly evaluated in relation to cell kinetic indices. The following sections consider the applications of in vivo kinetic data to chemotherapy and radiotherapy treatment.
9:3:1. Chemotherapy
Skipper and colleagues (1964) stated the principles of cancer chemotherapy which established the importance of cell kinetic theory in the design of treatment regimes. These principles were:
- That a single malignant cell can grow into a lethal tumour.
- That tumour growth is Gompertzian. Exponential growth is followed by exponential retardation of growth as the number of cells increases.
- A given dose of drug kills a constant fraction of cells, regardless of the total cell mass.
- There is an inverse relationship between cell number and curability. A tumour weighing one milligram is estimated to contain 106 cells. A tumour weighing one kilogram contains 1012 cells.
Skipper used these principles to demonstrate a dramatic improvement in treatment of the L1210 leukemia cell line in mice. A further observation of this period was that cytotoxic agents often showed substantial selectivity for tumour over normal cells. Many clinical studies were devised to take advantage of perceived cell cycle specific and kinetic actions of single and combination drug treatments.
9:3:2. Drug action at the cellular level
The basis of cytotoxic fractionation is that many drugs act selectively in particular phases of the cell cycle, and in particular upon cycling cells. Drugs are often more effective in multiple doses or infusions than in single doses. Drug treatments may be scheduled to optimise the therapeutic index. The mechanisms of drug action are lethal or non-lethal, cytotoxic or cytostatic, including intercalation, alkylation, anti-mitosis and metabolic inhibition (eg Methotrexate). The age response of cycling cells is an indicator of the phase of the cell cycle at which maximum drug effect occurs. For example, the maximum age response of methotrexate may be at the G1/S point in the cycle (Mauro 1986). The mechanisms of drug action can be determined from in vitro cell culture experiments using synchronised cells, plotting the survival fraction of cells in culture against the dose of drug under test. Cells in culture grow exponentially until contact growth inhibition occurs. Cytotoxic agents are most useful against rapidly proliferating populations, and conversely of least use against slowly cycling cells including stem cells, hypoxic cells and cells in G0.
Mauro (1986) observed that even controlled in vitro studies of drug action produce variable results according to temperature, choice of medium and serum. These features are manifested as a resistance to a drug by an individual tumour. The in vivo measurement of the kinetics of drug perturbed populations is thus preferable to laboratory studies. It should take account of asynchrony and post treatment enhancement of growth. Cell depletion may be a potent stimulus to bring G0 cells back into the cycling population.
1. Synchrony
A perfectly asynchronous cell population in culture has a stable age distribution over the cell cycle. Populations in synchrony are all coordinated or in phase at a given point in the cell cycle. Untreated growing tumour cells in vivo are randomly distributed in cell cycle stage, that is asynchronous. Population synchrony can be induced at particular points in the cell cycle by pulse treatment with particular drugs, and (at least partial) synchrony can be maintained by repeated pulses of the drug. Progressive synchrony leaves surviving cell populations more susceptible to subsequent drug doses. The timing of the drug doses to achieve "optimal synchrony" may be a function of the cell cycle time or of the duration of individual phases of the cell cycle.
2. Post treatment enhancement of growth.
Experiments have shown that changes can occur in the cell cycle time of surviving cells following irradiation. This may also apply to drug treatment. According to methodology used, there may be shortening or lengthening in the cell cycle time. Surviving cells undergo rapid division to repopulate the tumour with viable cells. Because of this phenomenon, pre-treatment measurement of the tumour kinetics may be of limited value. Conversely, measurement of the phase duration after initial treatment may be very important in planning further treatment. Ts measurements might be particularly valuable in this regard.
9:3:3. Limitations of kinetic theory in clinical chemotherapy
Early success in chemotherapy is often followed by relapse and subsequent failure of chemotherapy despite the application of kinetic principles (deVita 1983). Small populations of stem cells with maximum malignant potential may not have the same drug sensitivity as the majority of cells in the population (Tannock 1986). Other important factors may contribute to the failure of tumour chemotherapy. Mutant, drug resistant cell lines may be selected early in treatment and supercede the drug-sensitive cells (deVita 1983). Drug resistance mechanisms possessed by cells include the Multi-drug Resistance (MDR) phenotype. MDR is believed to result from a single mutation, and is mediated at the cell membrane through the 170,000MW P-glycoprotein (Kartner and Ling, 1989). This protein may act as a pump to remove toxins from cells. Its levels are reported to be increased in experimental tumour cell lines with drug resistance. The MDR phenotype can be conferred to drug-sensitive mouse cells by gene transfer. MDR may explain in part the frequent failure of chemotherapy to control micrometastases. In theory, these ought to be particularly susceptible to treatment, being homogenous, monoclonal, actively cycling and containing relatively few cells. Genetic defence mechanisms may render them less sensitive to chemotherapy.
It would be valuable to establish whether individual tumour cell kinetic data can be used to select the most appropriate chemotherapeutic agent and to improve the understanding of in vivo drug action, for example, by measuring tumour cell kinetics before and after a course of a chemotherapeutic agent. Steel observed (1977) that cytotoxic drug dosage schedules were chosen largely on the basis of guesswork, and that the best approach to improving schedules was "trial and error". Tannock (1978) claimed that kinetic data was of no value either in selecting drugs or in predicting response. As observed above, the outcome of kinetic based therapy may be affected by changes in kinetic characteristics during the course of the treatment itself. Simpson-Herren (1982) and Mauro (1986) observed that the results of many efforts to design chemotherapy regimes based on growth kinetics have been inconclusive. Mauro has also observed how flow cytometry has demonstrated the complexity of heteroploid populations in solid tumours.
There are difficulties in applying the results of cell culture studies to human tumours which have cellular and tissue heterogeneity, including aneuploid subpopulations. Within tissues, drug efficacy is affected by factors such as differences in vascularity, oxygenation and the permeability of cellular stroma. Environmental heterogeneity, variable fractions of proliferating cells and complex interactions with the host immunological system all affect the validity of cell culture data. For example, suppression of the host immune response may actually enhance tumour growth. The efficacy of drugs in whole organisms is also affected by differences in drug uptake, metabolism and excretion from cells.
It is important to be precise in the use of the term "kinetic" in its clinical applications. Some studies describe "kinetic" approaches to therapy which do not in fact use cell kinetic data (Hill and Price 1982). Whether the benefits of treatment are due in any way to kinetic scheduling is a
matter for debate. Side effects of chemotherapy, including neutropenia, often outweigh theoretical benefits in the fractionated use of drugs. In practice, cytotoxic agents are used on an empirical basis. Satisfactory use has not yet been made of cell cycle concepts to produce demonstrable benefits in clinical practice. Ultimately, testable hypotheses must be challenged in well designed, prospective clinical trials.
BRdU and FCM techniques may allow the use of kinetic data to be tested in the chemotherapy of human tumours. Pallavicini et al (1985) treated L1210 mouse leukemic cells with cytosine arabinoside (Ara-C), a cytostatic drug specific for the S phase. They showed that in tumour strains sensitive to Ara-C, Ara-C given immediately before BRdU completely blocked BRdU uptake and by inference the S phase (see also Gray 1986). It is also possible to determine the frequency of drug-resistant cells in a population (Waldman et al 1985). Epstein et al (1988) have reported the use of multiparameter FCM to detect cell cycle delay of human breast cancer cells treated with colcemid.
Mauro (1986) considered the theoretical implications of using BRdU to monitor the cytostatic effects of anti-neoplastic agents in vivo. Epstein et al (1988) reported a flow cytometric assay of cytotoxic drug action to distinguish cells delayed in G2 from cells progressing to mitosis. Flow cytometry may be used to study populations of cells perturbed by means other than cytotoxic drugs. For example, Kaufman et al (1985) studied the effect on DNA replication and differentiation in rat myoblasts of antibodies against Actin and alpha-2-macroglobulin.
differentiation in rat myoblasts of antibodies against Actin and alpha-2-macroglobulin.
9:3:4. Chemotherapy and human solid tumour treatment
In clinical practice, cytotoxic "kinetic" chemotherapy has been used most effectively against haematogenous and lymphopoietic tumours. Because the rate of proliferation and hence the chemosensitivity is believed to be maximum when the tumour is small (Watson 1976), optimal treatment is likely to be achieved early in the disease or at the time of likely dissemination of tumour cells. Therapeutic gain is thus likely to be greater at the time of surgery (See Taylor 1985) than when the disease is advanced or recurrent. It is possible that in vivo measurement of tumour cell kinetics by FCM and BrdU labelling will be helpful in improving treatment strategies. The benefits may prove to be greatest if measurements are performed during treatment, as pre-treatment kinetics may give no indication of later developments. Several sources of data may be helpful. Firstly, a ploidy analysis will give an indication of tumour heterogeneity. Secondly, the LI will indicate the proportion of proliferating cells. Thirdly, the Ts will guide the timing of dose fractionation. These theories may be tested in animal models. Proper application of kinetic theory may not be the only route to better chemotherapy, but worthwhile improvements may yet be achieved.
9:4:1. Radiotherapy
Kinetic theory is also important in radiotherapy. The clinical effectiveness of radiotherapy depends upon achieving a maximal tumouricidal effect while minimising damage to normal tissues. Radiotherapy in experimental conditions is controllable both in dose and direction. It has long been known that dividing a dose of radiotherapy into smaller fractions separated in time improves the therapeutic ratio. From experimental data, optimal tissue sparing radiotherapy fractionation schedules can be estimated which allow the maximum possible dose to be directed to the tumour (Denekamp 1986, Peters et al 1988).
The theory of fractionated radiation therapy.
Tumour cells with disordered growth may be less able to "repair, redistribute, reoxygenate and repopulate" than normal tissues. The repair of radiation damage can be described by plotting a survival curve for tissues in response to varying doses of radiotherapy. Cells are known to tolerate and overcome sublethal radiation doses. Because tumours are composed of heterogenous cells in various phases of growth, a single controlled dose of irradiation will not affect all cells equally, but will kill S phase cells preferentially. The rate of growth of a tumour or tissue determines its response to radiotherapy. Repopulation and redistribution (for example of the proportions of resting to cycling cells) of a tissue during treatment will tend to decrease the effectiveness of treatment. Rapidly proliferating tissues, despite high radiosensitivity, will tend to repopulate rapidly. Kummermehr (1982) reported that the rate of repopulation approximates to the Tpot rather than to the pretreatment doubling time. A consequence of the selectivity of radiotherapy for cells in S phase is that irradiated tissues tend to become synchronised in their cell cycles. Repair and repopulation tend to increase the total dose of radiation needed to achieve a given degree of damage.
Hypoxic cells are relatively radio-resistant. The tendency to hypoxia varies with time, treatment and position. Some cells in experimental systems become less hypoxic and thus more radiosensitive with treatment. Efforts have been made to improve the oxygenation of tissues during radiotherapy. These include using hyperbaric oxygen, or by using sensitiser drugs such as misonidazole and BRdU. Redistribution and reoxygenation tend to reduce the total dose of radiation needed to achieve a given degree of damage.
9:4:2. Time and dose relationships in radiotherapy.
Doses and time intervals of treatment can be varied to achieve the same biological effect. Isoeffect curves result from plotting log dose versus log time and can be described mathematically. According to their growth and proliferation characteristics, some tissues are fast- and some are slow-responders to radiotherapy. Isoeffect curves (as generated by studies on experimental animals) can be used to select the maximum separation of effect of treatment on different tissues. The same principle can be applied to human tumours, for example lingual tumour and oral mucosa, and has led to the concept of hyperfractionation using frequent low doses to minimise the effect on slowly proliferating tissues. Radiotherapy cannot be given without consideration to the early and late effects of treatment on tissues surrounding the tumour.
9:4:3. Continuous, hyperfractionated, accelerated radiotherapy (CHART).
BrdU/FCM derived data may prove to have practical uses in radiotherapy planning. If the duration of the cell cycle of tumour cells is known, the timing of successive fractions of irradiation may be adjusted to optimise the kill fraction of successive waves of tumour cells entering the S phase. For example, if a tumour with a very long cell cycle time is subjected to multiple fractions over a short time period, only one population of cells in S phase is likely to be killed. Cells in G1 and G2 throughout this period will survive to proliferate at a later date. By mistiming of fractionation, the radiotherapy treatment will have failed. It is now possible to test this hypothesis in clinical practice.
Dische and Saunders (1989) reported the correlation of Tpot data with a new radiotherapy regime for tumours such as squamous carcinomas of the head and neck. They noted the large proportion of human tumours which have a Tpot of less than five days. They propose that tumour cells which survive initial radiotherapy doses are likely to repopulate rapidly. The effect of radiation on normal tissues is a limiting factor in therapy. Conventional radiotherapy regimes allow periods of several days or weeks between treatments in order to allow normal tissue recovery. These regimes may be less effective than CHART regimes which use smaller but much more frequent radiotherapy doses to achieve maximum tumour cell kill within the limits imposed by normal tissue tolerance. For example, their CHART regime for advanced squamous tumours of the head and neck and bronchial tumours involves treatments of three fractions of 1.5 Gy daily for 12 successive days to a total of 54 Gy. They report significant improvements in tumour regression over a retrospective survey of conventional treatments without unmanageable side effects. They will correlate Tpot data with clinical outcome.
9:4:4. Cell kinetic data and radiosensitivity.
In vivo cell kinetic data may offer benefits to patients in the treatment of tumours considered to be radioresistant. It is possible that radio-sensitivity is a function of cell kinetic behaviour, although this may be modified by local factors such as relative hypoxia, thiol status and DNA repair mechanisms. Individual cycling cells do not possess mechanisms which prevent penetration and damage by ionising radiation. The overall behaviour of the population in relation to the frequency of radiotherapy doses is likely to determine the treatment outcome. It is possible that tumours such as gastrointestinal adenocarcinomas may be made radiosensitive by tuning the fractionation schedule for each tumour. Past lack of success of adjuvant radiotherapy for colorectal and gastric cancer may have been a consequence in part of the timing of fractionation.
Conventional radiotherapy regimes for colorectal cancer have been largely empirical. For example, the US Veterans Administration Surgical Adjuvant Trial in 1964 used 2000 rads in 10 fractions over 14 days immediately prior to surgery (Higgins, 1979). The UK Medical Research Council Trial of low-dose preoperative radiotherapy in operable rectal cancer in 1975 (Arnott 1979) used a similar regime but with an additional arm to the trial of a single dose of 500 rads. In Chapter 2 it was demonstrated that the mean Ts of colorectal tumours was 14.4 hours and the mean Tpot was 5.9 days. If a dose of 200 rads is given daily, a proportion of cells will not be in the S phase at the time of irradiation and therefore may survive to proliferate (all cells in G1, S, G2 and M phases are affected by sublethal irradiation, but the consequences are only expressed at mitosis). Because repair, redistribution, reoxygenation and repopulation will proceed during periods without regular treatment (such as at weekends), at the end of the course of treatment tumour kill may not have been achieved and the tumour may be more proliferative than at the outset.
As a hypothetical example, a 200 rad daily dose of treatment may be better given as 100 rads every 12 hours as a CHART regime. This would increase the fraction of cells which were irradiated during the S phase when they were more vulnerable to damage. This model is outlined in Figures 9:1 and 9:2. Treatments should continue every day. A limit of tolerance of normal adjacent tissues (particularly bladder and small bowel) would still be reached, but a much higher tumour cell kill fraction may have been achieved. Repopulation and any induced alteration in the Ts and Tpot could be assessed by BRdU labelling and biopsy during treatment.
9:5. Conclusions
It has not yet proved possible to identify or classify subgroups within the tumour categories studied on the basis of different kinetic characteristics with confidence. This is in part because the LI, Ts and Tpot data display a univariate distribution, with a broad interspecimen variation within individual tumours (see Chapter 2). It may be that tumours with kinetic characteristics at the extremes of the distributions show markedly different biological behaviour, but this will only be established by follow-up and survival analysis in due course. Most importantly, the kinetic data only provides a snapshot of the growth fraction and cell proliferation rate at the time of biopsy, and is not necessarily a predictor of future proliferation. Moreover, the proliferative activity of a tissue or tumour is almost certainly not (if at all) the only determinant of biological and neoplastic behaviour. The ability of cells to metastasise will be affected by their adhesiveness, their survival during transit and by their invasiveness and adhesion in secondary organs or nodes. Clonogenicity and the controls to abnormal growth are not measured by the cell kinetic data.
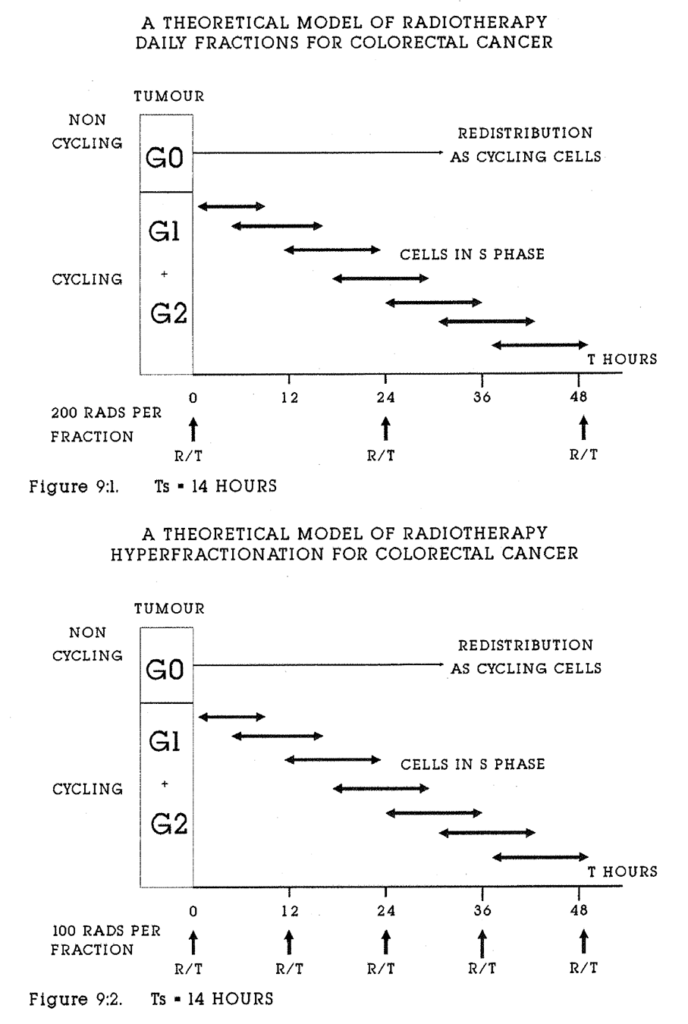
The case for the measurement in clinical practice of dynamic kinetic data in solid tumours by multiparameter FCM with BRdU (or IRdU) labelling for prognosis will not be established or refuted until adequate follow up data are available. Its use in prognosis in colorectal, gastro-oesophageal or breast disease is not yet established. Larger series of other tumours (eg lung, melanoma, lymphoma and sarcoma) will need to be studied before firm conclusions can be drawn about them. Applications of the data to adjuvant therapy hold out the potential for real improvements in cancer treatment.
Multiparameter flow cytometry and in vivo labelling of experimental and human tumours and tissues are valuable research tools. To broaden the knowledge of cell biology and proliferation gained from the study of nuclear antigens, better techniques for tissue disaggregation which preserve cytoplasmic and membrane antigens are needed. A number of routes for future investigation are indicated. These include the measurement of cytotoxic drug action on tumour cell kinetics in animal models, and the measurement of gene products in human cells. A review of Neoplastic Disease written in the year 2019 might aptly open with James Ewing's remarks. In the last decade of the twentieth century it is possible to study the morphology and histogenesis of tumours with tools far more powerful than the light microscope.
![]()
Appendix 2:A. Colonic adenocarcinomas: Origin, histological grade, Dukes stage, ploidy and potential doubling time. (Specimens 021 and 022 were not adenocarcinomas).
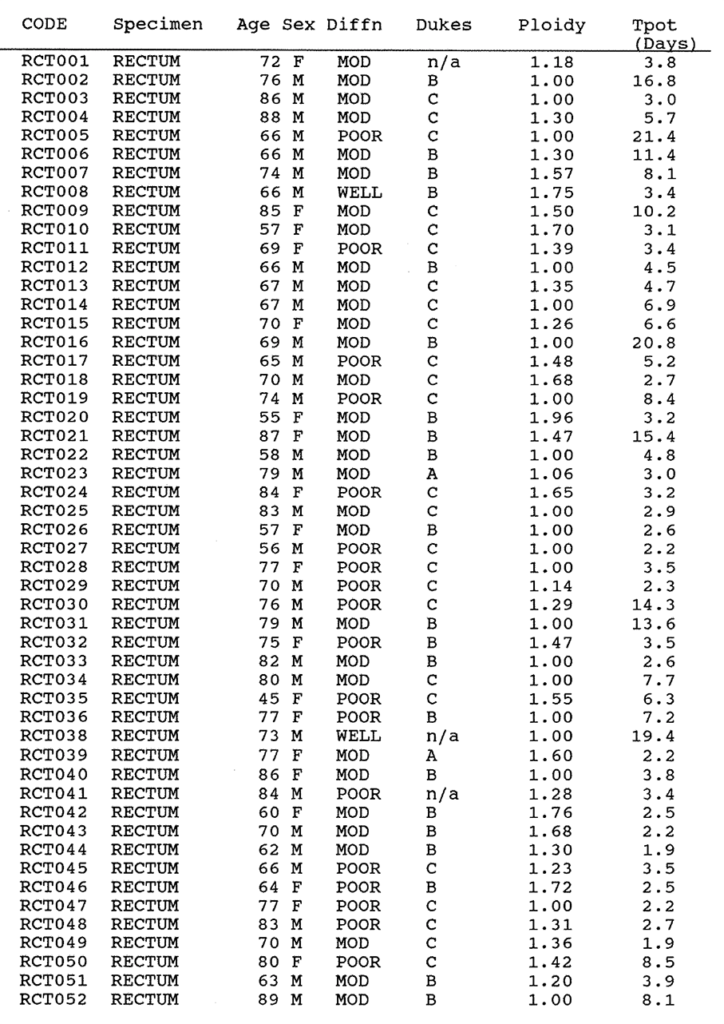
Appendix 2:A. Rectal Carcinomas. Origin, grade, Dukes, ploidy and Potential doubling time. 037 was not an adenocarcinoma.
![]()
Appendix 2:B. Colonic adenocarcinomas: Total and aneuploid labelling indices, Ts (hours), Relative Movement, Injection time (hours), maximum and minimum tumour diameters (cms).
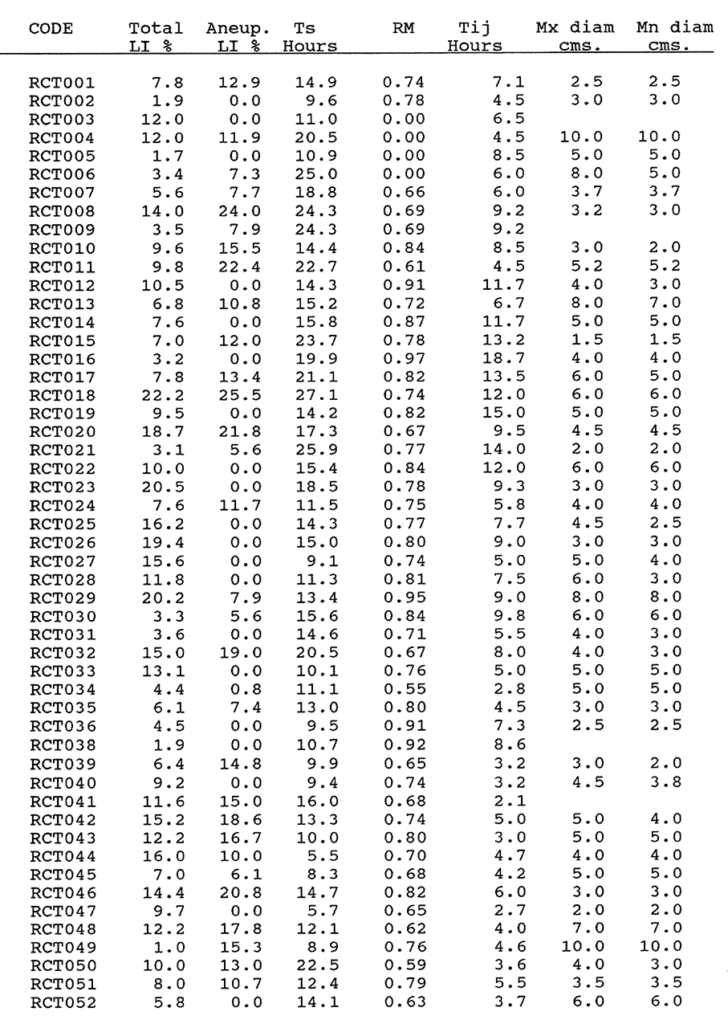
Appendix 2:B. Rectal Carcinomas. Data as for colonic tumours.
Appendix 2:C. The procedure for staining formalin fixed, wax embedded tissues labelled with Bromodeoxyuridine.
- Five micron sections are cut and dried on poly-l-lysene 0.1% (Sigma) coated slides for 48 hours at 37°C. Sections are then dewaxed for five minutes in Trichloroethane solvent.
- Sections are washed for five minutes in 99% methanol, then for five minutes in a solution of 90% Methanol BP and 10% (100 volume) hydrogen peroxide (H₂O₂) by volume at room temperature. (Endogenous peroxidase activity in the specimen is blocked with 0.1% H₂O₂ in methanol at room temperature for 30 minutes).
- Sections are washed in pre-warmed distilled water at 37°C for five minutes, and are transferred to fresh 0.1% trypsin solution for 13 minutes at 37°C. Trypsin activity is stopped with cold tap water.
- Slides are rinsed in de-ionised water, transferred to preheated 1.0M HCl at 60°C for 20 minutes, then washed well in tap water.
- Slides are washed in Tris buffered saline (TBS) for five minutes at pH 7.6 in the humidity chamber.
- Slides are incubated in Anti-BRdU antibody (ICRF) diluted 1/20 (4 drops = 200 microlitres per slide) for 60 minutes in the humidity chamber.
- Slides are washed in TBS three times for two minutes, then incubated with biotinylated rabbit anti-mouse antibody diluted 1/400 with 1% Human AB serum in TBS for 30 minutes in the humidity chamber.
- Slides are washed with TBS three times for two minutes, then Avidin (1/300 dilution) is added for 45 minutes.
- Slides are washed in TBS twice for two minutes, and rinsed in phosphate buffered saline (PBS) once for five minutes.
- DiaminoBenzadine solution (DAB) in PBS is added for 10 minutes, then slides are washed in tap water for five minutes.
- Slides are counterstained in CARRAZZI'S Haemotoxylin Blue for 30 seconds in running tap water, rinsed in methanol and then in Trichloroethanol. Slides are cover slipped with STYROLITE (BDH pharmaceuticals, Poole, Dorset).
Recipes for solutions.
TRIS/SALINE pH 7.6
NaCl 90gm
Tris 10gm
1.0 Molar HCl 70ml
Add Distilled Water to 10 Litres and check pH with a meter.
TRIS/HCL BUFFER with Calcium chloride.
Tris 1.3gm
1.0 Molar HCl 7.6ml
Distilled water to 1 litre
Add 1.0 gm fused granular Calcium Chloride.
Adjust pH to 7.8
0.1% TRYPSIN SOLUTION
100 ml TRIS/CaCl2 buffer
0.1 gram Trypsin powder
Correct to pH 7.8 using a few drops of deionised water saturated with Tris. Use a pH meter.
Diaminobenzadine solution.
10ml PBS
DAB powder 50mg
Three drops of 100 volume hydrogen peroxide.
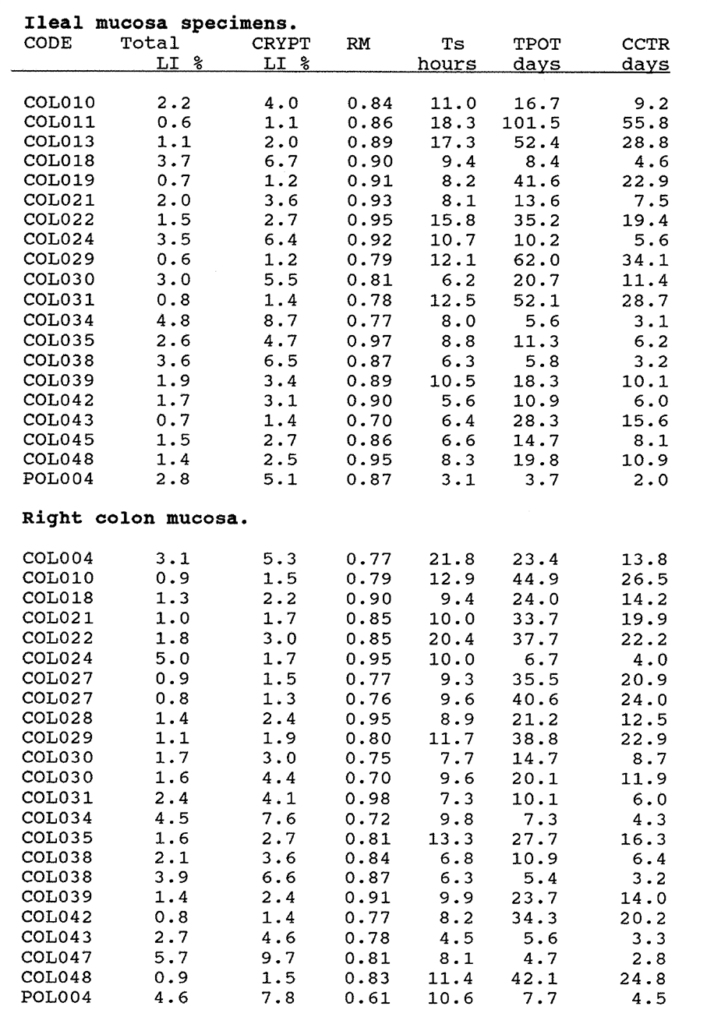
Appendix 3:A. The Total Labelling Index, Crypt Labelling Index, the Relative Movement, Ts, Tpot and Crypt Cell Turnover Rate of ileal and right colon specimens. The ileal crypt cell fraction was 0.55. The right colon crypt cell fraction was 0.59 (see text for explanation).
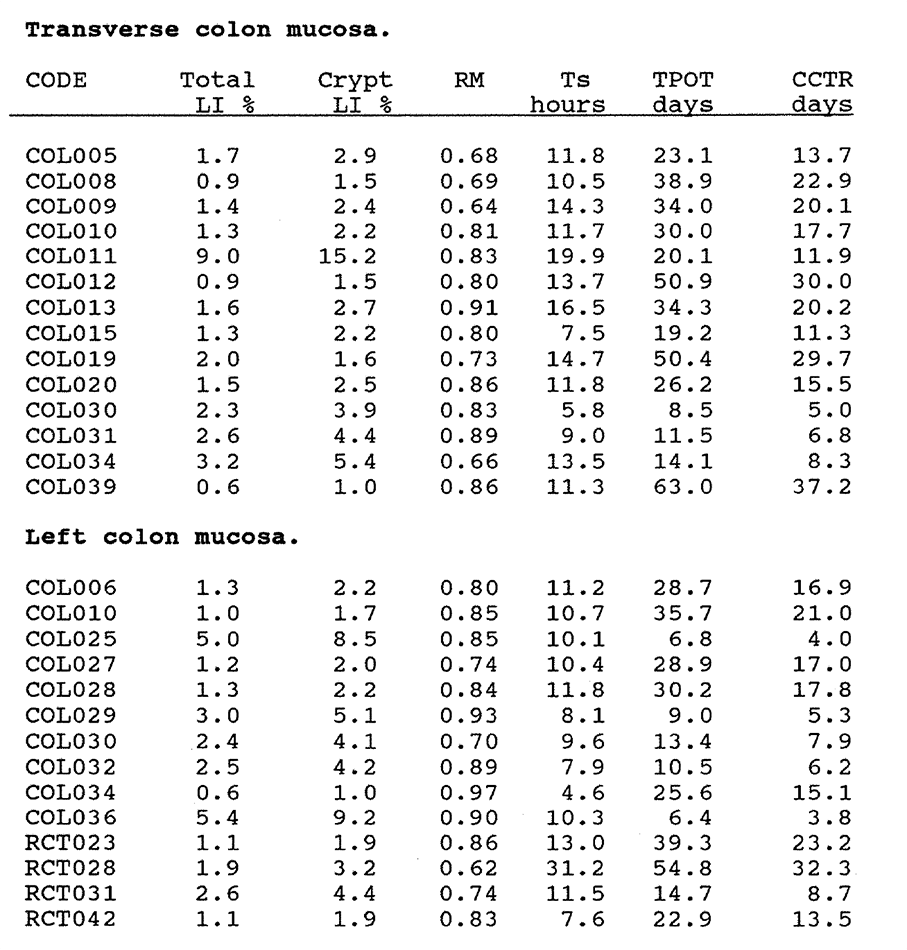
Appendix 3:A. The Total Labelling Index, Crypt Labelling Index, Relative Movement, Ts, Tpot and Crypt Cell Turnover Rate of transverse and left colon mucosa. A crypt cell fraction of 0.59 was used to correct the flow cytometric data.
Appendix 3:A.
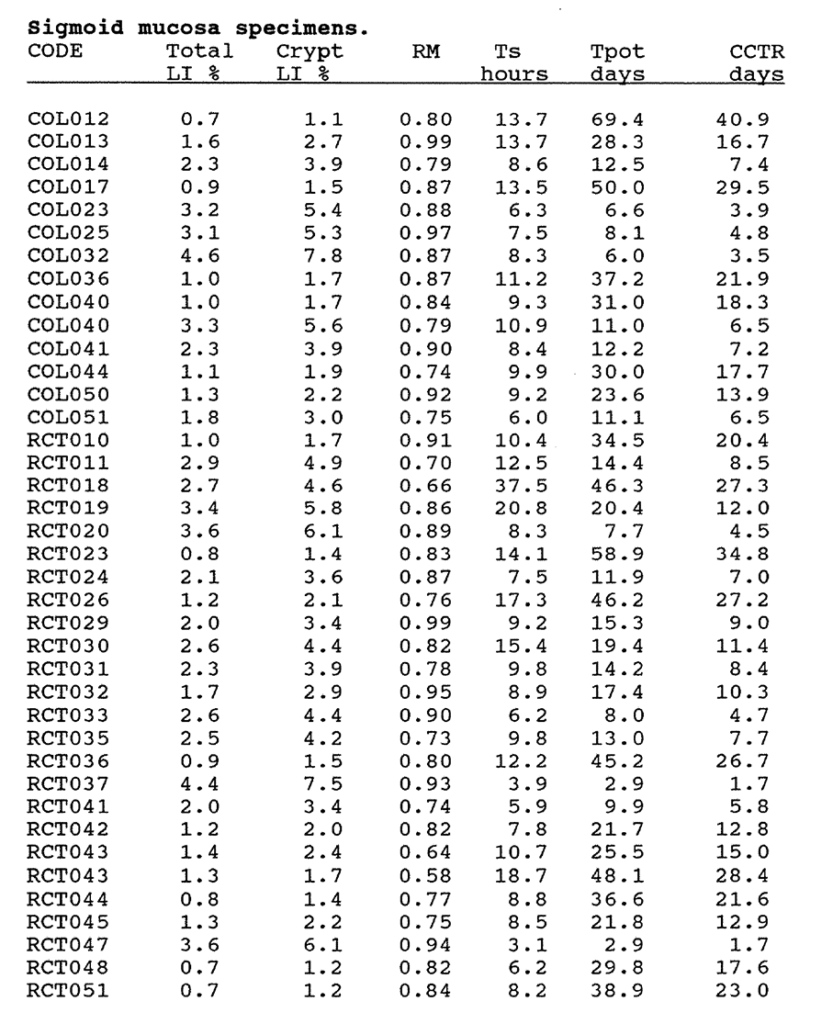
Appendix 3:A. The Total Labelling Index, Crypt Labelling Index, RM, Ts, Tpot and Crypt Cell Turnover Rate of sigmoid mucosa. The flow cytometric data was corrected by a crypt cell fraction of 0.59.
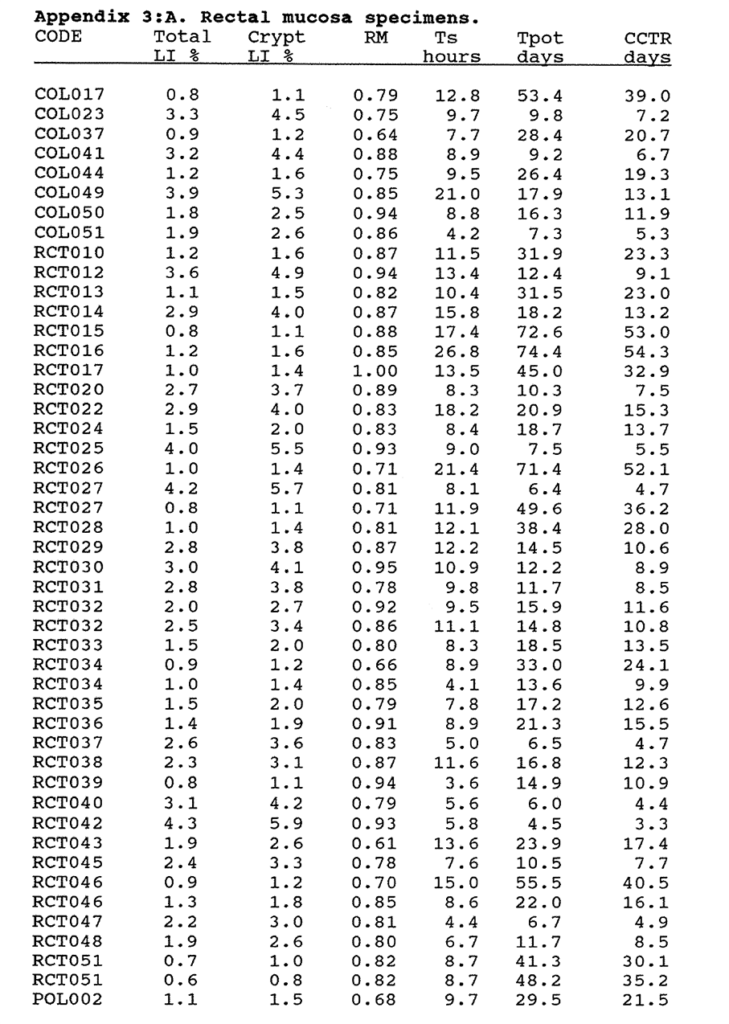
Appendix 3:A. The Total Labelling Index, Crypt Labelling Index, RM, Ts, Tpot and Crypt Cell Turnover Rate of rectal mucosa. A crypt cell fraction of 0.73 was used to correct the flow cytometric data.
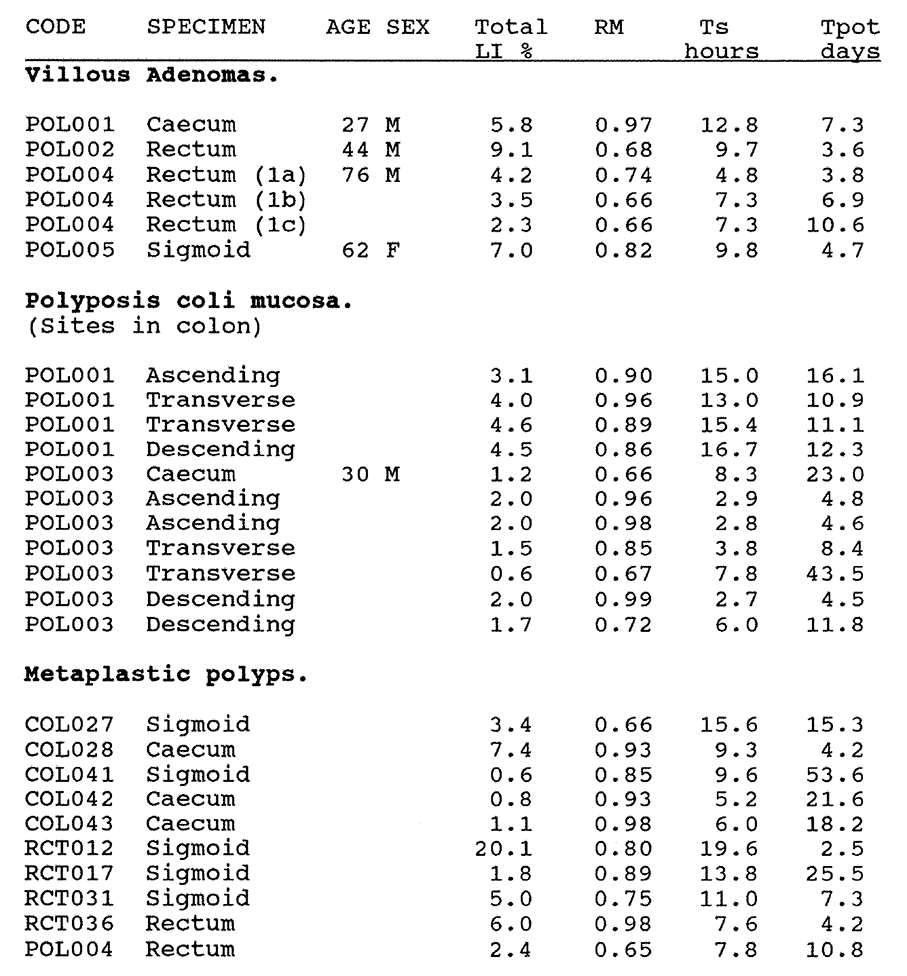
Appendix 3:A. The Total Labelling Index, Relative Movement, Ts and Tpot of Villous Adenomas, Polyposis Coli Mucosa and Metaplastic Polyps. The data is derived from flow cytometry with no corrections for crypt cell fractions.
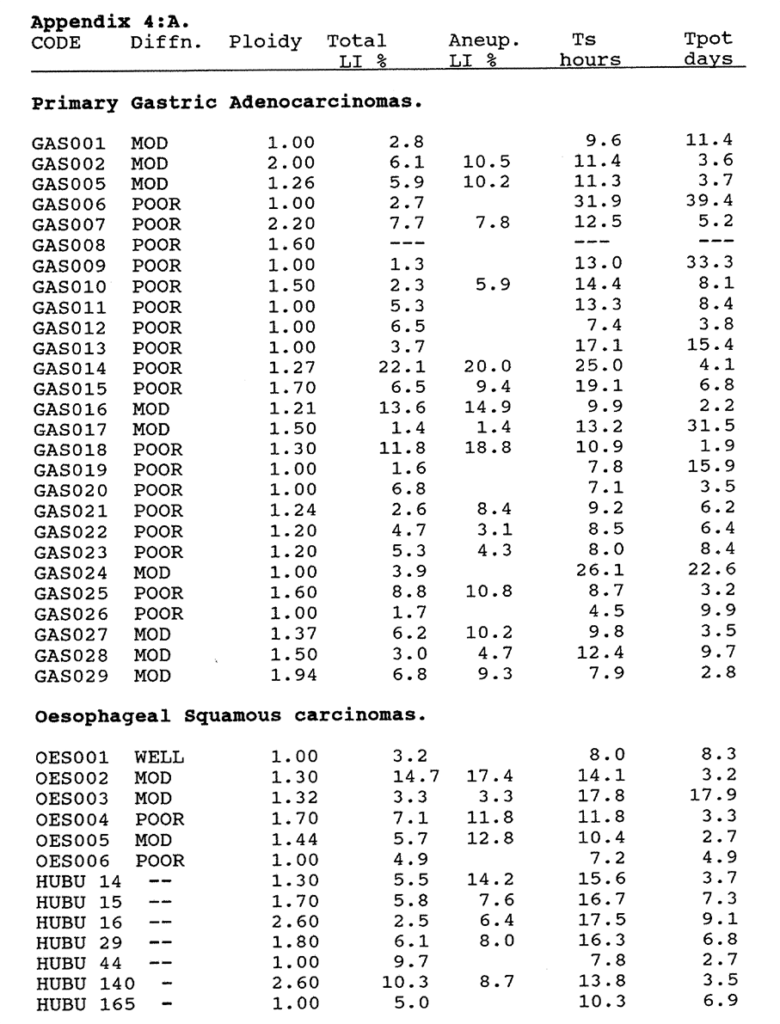
Appendix 4:A. The Total and Aneuploid Labelling Indices, Ts and Tpot of gastric and oesophageal carcinomas.
Tumours were well, mod(erately) or poor(ly) differentiated.
HUBU coded tumour data are included from the Mount Vernon Hospital series to supplement the squamous carcinoma data. Tumours GAS003 and GAS004 were not analysable.
![]()
Appendix 4:B. The flow cytometric data on the Total Labelling Index, Relative Movement, Ts and Tpot of upper gastrointestinal mucosa specimens. All were diploid. Data has not been corrected for the crypt cell fraction, which was not estimated in these tissues.
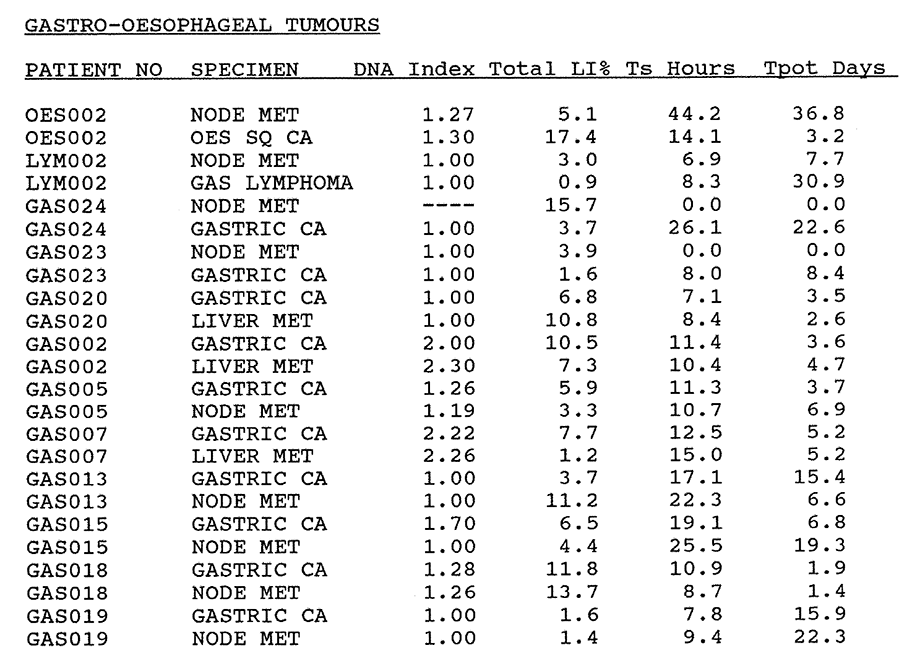
Appendix 4:C. Kinetic data of primary tumours and metastases compared.
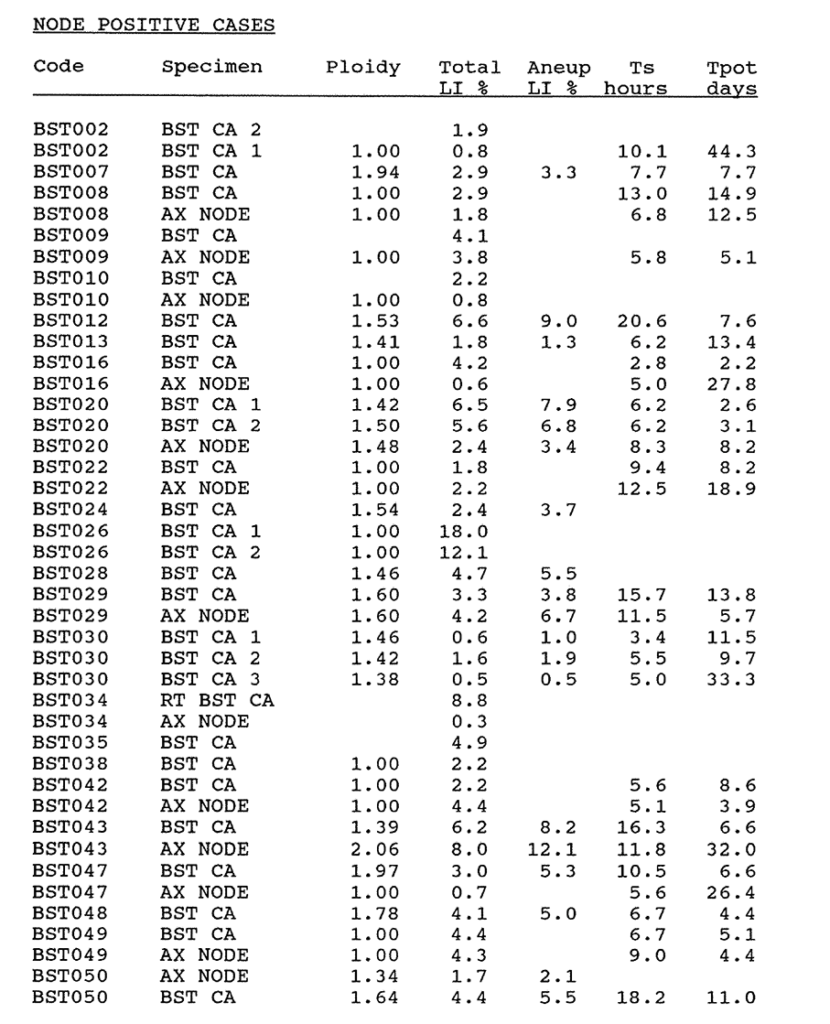
Appendix 6:A. The flow cytometry kinetic data on primary ductal node positive adenocarcinomas of the breast and corresponding node metastases where available. Multiple specimens are marked. Blank spaces indicate data which could not be calculated from unsatisfactory profiles.
![]()
Appendix 6:A. The flow cytometry kinetic data on primary ductal node negative adenocarcinomas of the breast. Multiple specimens are marked. Blank spaces indicate data which could not be calculated from unsatisfactory profiles.
![]()
Appendix 8:A. The DNA Index, mean p62c-myc content of the G1 Diploid and the G2 Diploid populations, the BRdU Labelling Index and the Tpot from the same samples of mucosa are shown. (see text for further explanation).
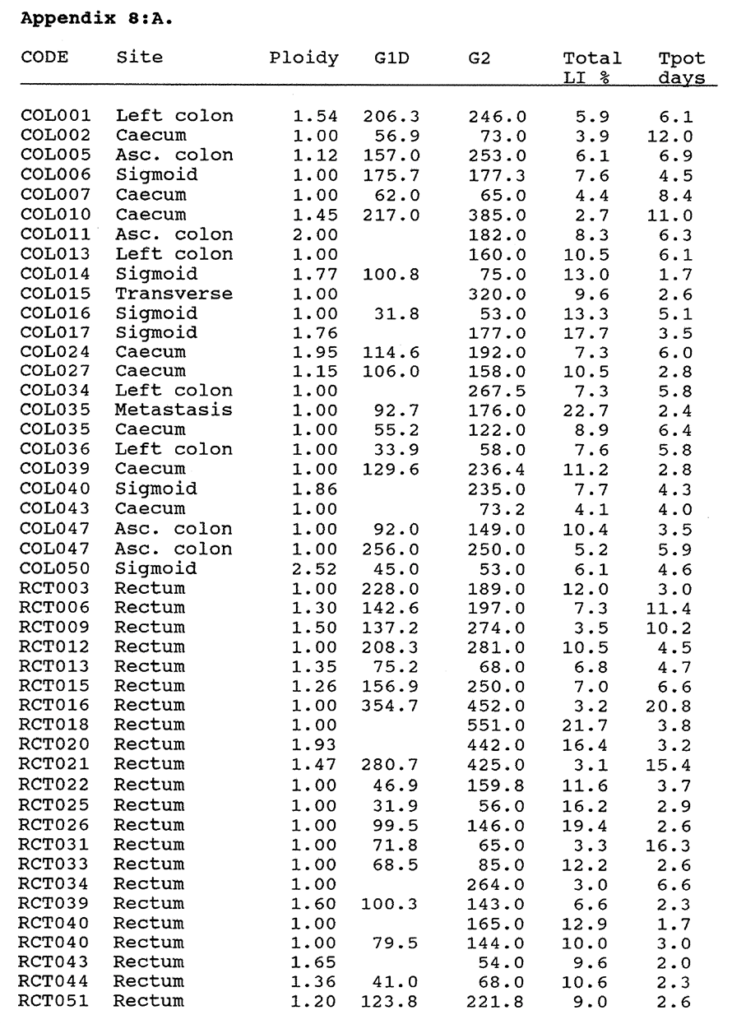
Appendix 8:A. Moderately differentiated carcinomas of the colon and rectum. The ploidy, mean G1 and G2 Diploid p62c-myc content, Total BRdU Labelling Index and Tpot are given (see text for explanation).
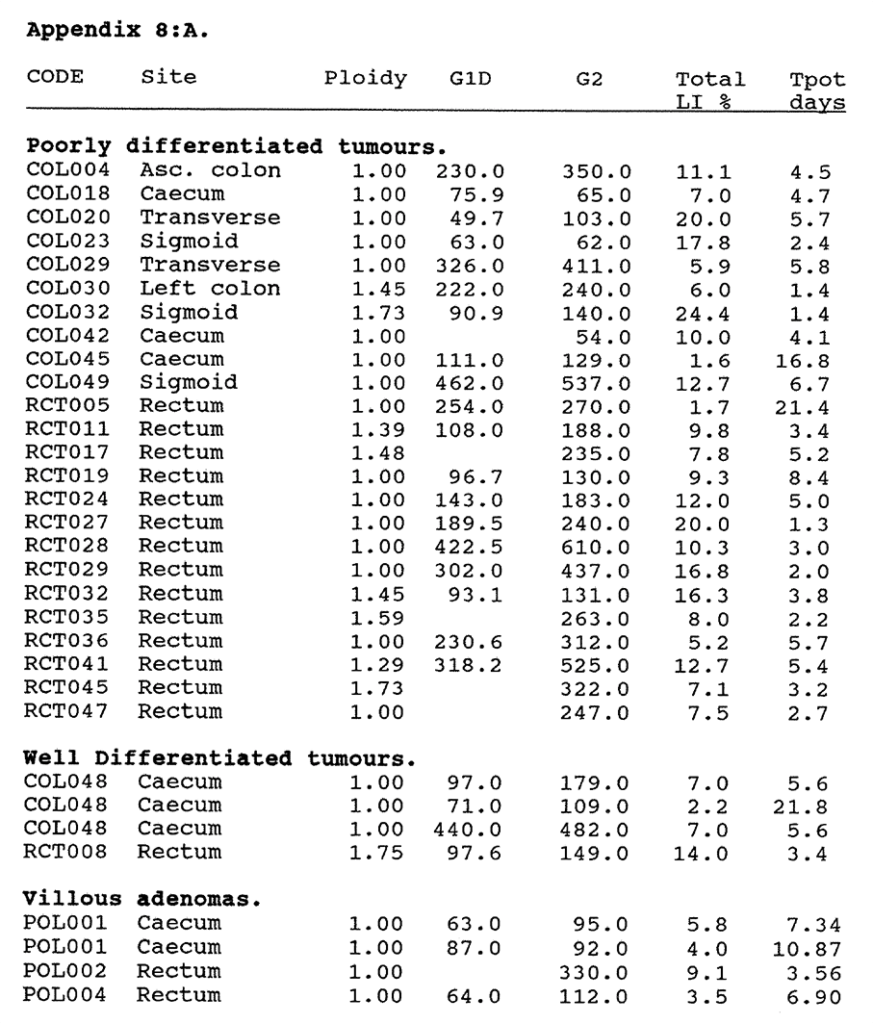
Appendix 8:A. The ploidy, G1 and G2 Diploid p62c-myc content, Total BRdU Labelling Index and Tpot of well and poorly differentiated tumours and villous adenomas (See text for explanation).
References
Aherne WA, Camplejohn RS, Al-Wiswasy M, Ford D, Kellerer AM. Assessment of inherent fluctuations of mitotic and labelling indices of human tumours. Brit J Cancer 1977, 36, 577-82.
Alama A, Nicolin A, Conte PF and Drewinko B. Evaluation of growth fractions with monoclonal antibodies to human &-DNA polymerase. Cancer Research 1987, 47, 1892-1896.
Andreeff M, Editor. Clinical Cytometry. Annals NYAS 1986, 468, 1-407.
Armitage NC, Robins RA and Evans DF. The influence of tumour cell DNA abnormalities on survival in colorectal cancer. Brit J Surg 1985, 72, 828-30.
Arnott SJ. Preoperative radiotherapy in operable rectal cancer. in Controversies in Cancer. Massom Publishing, 1979, Chapter 16, 139-144.
Ballantyne KC, James PD, Robins RA, Baldwin RW and Hardcastle JD. Flow cytometric analysis of the DNA content of gastric cancer. Br J Cancer 1987, 56, 52-4.
Barlogie B. et al. Flow Cytometry in Clinical Cancer Research. Cancer Research 1983, 43, 3982-3997.
Barnard NJ, Hall PA, Lemoine NR and Kadar N. Proliferative index in breast carcinoma determined in situ by Ki-67 immunostaining and its relationship to clinical and pathological variables. J Pathol 1987, 152, 287-295.
Barnes DM. Breast cancer and a proto-oncogene: C-erbB-2 is a reliable prognostic marker. Brit Med J 1989, 299, 1061-2.
Barrett JC, Tsutsui T and Ts'o POP. Neoplastic transformation induced by a direct perturbation of DNA. Nature 1978, 274, 229-232.
Baserga R, Editor. Factors affecting growth of mammalian cells. Annals NY Acad Sci, 1982, 397, 1-33.
Baserga R, Waechter DE, Soprano KJ and Galanti N. Molecular biology of cell division. Annals NY Acad Sci 1982, 397, 110-120.
Baserga R. Growth in size and cell DNA replication. Exp Cell Res 1984, 151, 1-5.
Baserga R. Molecular biology of the cell cycle. Int J Radiat Biol 1986, 49, 2, 219-226.
Bauer KD and Clevenger CV. Nuclear antigens as markers of cell growth, proliferation and differentiation. Abstract 801 Int Conference of analytical cytology XI, 1985.
Begg AC, McNally NJ, Shrieeve DC and Karcher H. A method to measure the duration of DNA synthesis and the potential doubling time from a single sample. Cytometry 1985, 6, 620-626.
Begg AC, Moonen L, Hofland I, Dessing M and Bartelink H. Human tumour kinetics using a monoclonal antibody against iododeoxyuridine. intra-tumour sampling variations. Radiother Oncol 1988, 11(4), 337-47.
Beisker W, Dolbeare F and Gray JW. An improved immunocytochemical procedure for high sensitivity detection of incorporated BrdU. Cytometry 1987, 8, 235-239.
Bishop M. Oncogenes. Scient American, March 1982. 69-78.
Bleiberg H, Mainguet P, Galand P et al. Cell renewal in the human rectum. An in vitro autoradiographic study on active ulcerative colitis. Gastroenterology 1970, 58, 851-5.
Bleiberg H, Mainguet P, Galand P. Cell renewal in familial polyposis. Comparison between polyps and adjacent healthy mucosa. Gastroenterology 1972, 63, 240-5.
Bleiberg H and Galand P. In vitro autoradiographic determination of cell kinetic parameters in adenocarcinomas and adjacent healthy mucosa of human colon and rectum. Cancer Res 1976, 36, 325-8.
Bleiberg H, Salahadin A, Galand P. Cell cycle parameters in human colon. Cancer, 1977, 39, 1190-4.
Bleiberg H, Buyse M, Van den Heule B and Galand P. Cell cycle parameters and prognosis of colorectal cancer. Eur J Cancer Clin Oncol, 1984, 20, 391-6.
Bolin S, Nillson E and Sjodal R. The growth rate of carcinoma of the colon. An Surg 1983, 198, 151-8.
Bontenbal M and 6 coauthors. Effect of hormonal manipulation and Doxorubicin administration on cell cycle kinetics of human breast cancer cells. Br J Cancer 1989, 60, 688-92.
Bresciani F, Paoluzi R, Benassi M, Nervi C, Casale C and Ziparo E. Cell kinetics and growth of squamous cell carcinomas in man. Cancer Research 1974, 34, 2405-2415.
Calabretta B, Kaczmarek L, Ming P, Au F and Mang S. The expression of c-myc and other cell cycle dependent genes in human colon neoplasia. Cancer Research, 1985, 45, 6000-4.
Camplejohn RS, Bone G and Aherne WA. cell proliferation in rectal carcinoma and normal rectal mucosa. A stathmokinetic study. 1973, Europ. J Cancer 9, 577-581.
Camplejohn RS, Cell Kinetics of colorectal tumours. Recent Results Cancer Res 1982, 83, 21-30.
Capurso L. Abstract. Gastroenterology, 1982, 82, 1029.
Caspersson T, Lomakka G and Caspersson O. Quantitative cytochemical methods for the study of tumour cell populations. Biochem Pharmacol 1960, 4, 113-127.
Chauvel P, Courdi A, Gioanni J, Vallicioni J, Santini J and Demard F. The labelling index: a prognostic factor in head and neck carcinoma. Radiotherapy and Oncology 1989, 14, 231-7.
Chavaudra N, Richard JM and Malaise EP. Labelling index of human squamous cell carcinomas. Cell Tissue Kinet 1979, 12, 145-152.
Cheng H, Bjerknes M and Amar J. Methods for the determination of Epithelial cell kinetic parameters of human colonic epithelium isolated from Surgical and biopsy specimens. Gastroenterology 1984, 86, 78-85.
Chwalinski S, Potten CS and Evans G. Double labelling with bromodeoxyuridine and 3H-thymidine of proliferative cells in small intestinal epithelium in steady state and after irradiation. Cell Tissue Kinet 1988, 21, 317-29.
Clemens M. Interferons and oncogenes. Nature 1987, 313, 531-532.
Cole JW and McKalen A. Studies on the morphogenesis of adenomatous polyps in the human colon. Gastroenterology 1961, 41, 122-5.
Constantini CR, Theillet C, Hutzell P, Merlo G, Schlom J and Callaghan R. In situ detection of c-myc mRNA in adenocarcinomas, adenomas and mucosa of human colon. J Histochem Cytochem 1989, 37, 3, 293-8.
Coon JS, Schwartz D, Summers JL, Miller AW and Weinstein RS. Flow cytometric analysis of deparaffinised nuclei in urinary bladder carcinoma. Cancer 1986, 57, 1594-1601.
Cornelisse CJ, Van de Velde CJH, Caspers RJC, Moolenaar AJ and Hermans J. DNA Ploidy and survival in breast cancer patients. Cytometry 1987, 8, 225-234.
Courdi A, Hery M, Dahan E, Gioanni J, Abbes M, Monticelli J, Ettore F, Moll JL and Namer M. Factors affecting relapse in node negative breast cancer. A multivariate analysis including the Labelling index. Eur J Cancer Clin Oncol 1989, 25, 2, 351-6.
Crissman HA and Steinkamp JA. A new method for rapid and sensitive detection of BrdUrd in DNA-replicating cells. Exp Cell Res 1987, 173, 1, 256-261.
Czerniak B, Herz F, Wersto RP and Koss LG. The expression of Ha-ras oncogene p21 protein in relation to the cell cycle of cultured human tumour cells. Am J Path 1987, 126, 3, 411-416.
Dang CV, McGuire M, Buckmire M and Lee WM. Involvement of the Leucine Zipper region in the oligomerization and transforming activity of human c-myc protein. Nature 1989, 337, 664-6.
Darzynkiewicz Z, Traganos F and Staiano-Coico L. Cell and nuclear growth during G1-Kinetic and clinical implications. Annals NYAS (1986), 468, 45-54.
de Aretxabala X and 6 co-authors. DNA ploidy pattern and tumour spread in gastric cancer. Br J Surg (1988), 75, 770-3.
Denekamp J. Cell kinetics and radiation biology. Int J Radiat Biol 1986, 49, 2, 357-380.
Denhardt DT, Edwards DR, Parfett CLJ. Gene expression during the mammalian cell cycle. Biochimica et Biophysica Acta 1986, 865, 83-125.
Dent G, Leglise MC, Pryzwansky KB and Ross DW. Simultaneous paired analysis by flow cytometry of cell surface markers, cytoplasmic antigens or oncogene expression with DNA content. Cytometry 1989, 10, 192-6.
Deschner EE and Maskens AP. Significance of the labelling index and labelling distribution as kinetic parameters in colorectal mucosa of cancer patients and DMH treated animals. Cancer 1982, 50, 1136-41.
Deschner EE and Lipkin M, Cell proliferation in normal, preneoplastic and neoplastic gastrointestinal cells. Clin Gastroenterol 1976, 5(3), 543-561.
DeVita VT. The relationship between tumour mass and resistance to chemotherapy. Cancer 1983, 51, 1209-20.
Dische S and Saunders MI. Continuous, hyperfractionated, accelerated radiotherapy (CHART). Brit J Cancer 1989, 59, 325-6.
Dolcetti R, De-Re V, Viel A, Pistello M, Tavian M and Boiocchi M. Nuclear oncogene amplification or rearrangement is not involved in human colorectal malignancies. Eur J Cancer Clin Oncol 1988, 24 (8), 1321-8.
Dolbeare F, Gratzner H, Pallavcini M and Gray JW. Flow cytometric measurement of total DNA content and incorporated BrdUrd. Proc Nat Acad Sci 1983, 80, 5573-5577.
Dolbeare F, Beisker W, Pallavicini MG, Vanderlaan M and Gray JW. Cytochemistry for BrdUrd/DNA analysis. stoichiometry and sensitivity. Cytometry, 1985, 6, 521-530.
Dowle CS, Owainati A, Robins A, Burns K, Ellis IO, Elston CW and Blamey RW. Prognostic significance of the DNA content of human breast cancer. Brit J Surg 1987, 74, 133-6.
Dressler LG, Seamer LC, Owens MA, Clark GM and Macguire WL. DNA flow cytometry and prognostic factors in 1331 frozen breast cancer specimens. Cancer 1988, 61, 420-7.
Dukes CE. The classification of cancer of the rectum. J Pathol Bacteriol 1932, 35, 323-333.
Dunlop MG, Ashton Rickhardt P, and Wyllie AH. Chromosome 5 allele losses in familial and sporadic colorectal adenomas and carcinomas. Abstract 66, SRS Liverpool Meeting, Jan 1990- Brit J Surg 1990 In press.
Durrant LG, Robins RA, Ballantyne KC, Marksman RA, Hardcastle JD and Baldwin RW. Enhanced recognition of human colorectal tumour cells using combinations of monoclonal antibodies. Br J Cancer 1989, 60, 855-860.
Earlam R and Cuhna-Melo JR. Oesophageal squamous cell carcinoma. A critical review of surgery. Br J Surg 1980, 67, 381-90.
Eccles SA. The role of oncogenes in metastasis. Cancer Topics 1989, 42-46.
Edwards JM, Jones DJ, Wilkes SJL, Hillier VF and Hasleton PS. Ploidy as a prognostic indicator in oesophageal squamous carcinoma and its relationship to various histological criteria. J Pathol 1989, 159, 35-41.
Epivanova O and Polunovsky VA. Cell cycle controls in higher eukaryotic cells. resting state or a prolonged G1 period? J Theor Biol 1986, 120, 467-477.
Epstein RJ, Watson JV and Smith PJ. Subpopulation analysis of drug-induced cell cycle delay in human tumour cells using 90 degree light scatter. Cytometry 1988, 9, 349-358.
Erisman MD, Scott JK and Astrin SM. Evidence that the familial polyposis coli gene is involved in a subset of colon cancers with a complementable defect in c-myc regulation. Proc Natl Acad Sci USA 1989, 86 (11), 4264-8.
Evan G, and Hancock D. Nuclear structures containing p62c-myc. Cell 1985, 43, 253-61.
Evan G, Lewis GK, Ramsay G and Bishop JM. Isolation of monoclonal antibodies specific for human and mouse proto-oncogene products. Mol Cell Biol 1985, 5, 3610-3616.
Farrar WB, Sickle-Santello BJ, Keyhani-Rofagha S, DeCenzo JF and O'Toole RV. Follow up on flow cytometric DNA analysis of squamous cell carcinoma of the tongue. Am J Surg 1989, 157, 377-380.
Feichter GE and Goerttler K. Pitfalls in the preparation of nuclear suspension from paraffin embedded tissue for flow cytometry. Cytometry 1986, 7, 616.
Fielding JWL, Ellis DJ, Paterson J, Powell DJ, Waterhouse J and Brookes VS. Natural history of early gastric cancer. Results of a 10 year regional survey. Br Med J 1980, 281, 965.
Fiennes AGTW. Growth rate of human tumour xenografts measured in nude mice by in vivo cast modelling. Br J Surg 1988, 75, 23-4.
Fine JD and Breathnach SM. Distinctive eruption characterised by linear supravenous papules and erythroderma following bromoxuridine therapy and radiotherapy. Arch Dermatol 1986, 122, 2, 199-200.
Finley GG, Schultz NT, Hill SA, Geiser JR, Pipas JM and Meisler AI. Expression of the c-myc gene family in different stages of human colorectal cancer. Oncogene 1989, 4, 8, 963-71.
Fordham MVH, Burdge AH, Matthews J, Williams G and Cooke T. Prostatic carcinoma cell DNA content measured by flow cytometry and its relation to clinical outcome. Br J Surg 1986, 73, 400-403.
Frankfurt OS, Arbuck SG, Chin JL and Greco WR. Prognostic applications of DNA Flow Cytometry for human solid tumours. Annals NYAS 1986, 468, 276-290.
Frankfurt OS, Slokum HK and Rustum YM. Flow cytometric analysis of DNA aneuploidy in primary and metastatic human solid tumours. Cytometry 1984, 5, 71-80.
Frindel E, Malaise E and Tubiana M. Cell proliferation kinetics in five solid human tumours. Cancer 1968, 22, 611-621.
Galand P, Mainguet P and Arguello J. In vitro autoradiographic studies of cell proliferation in the gastrointestinal tract of man. J Nucl Med 1968, 9, 37-9.
Garcia RL, Coltrera MD and Gown AM. Analysis of proliferative grade using anti PCNA/Cyclin monoclonal antibodies in fixed, embedded tissues. Am J Path 1989, 134, 4, 733-739.
Gentili C, Sanfilippo O and Silverstrini R. Cell proliferation and its relation to clinical features and relapse in breast cancer. Cancer 1981, 48, 974-9.
Gerdes J, Schwab U, Lemke H and Stein H. Production of a mouse monoclonal antibody reactive with human nuclear antigen associated with cell proliferation. Int J Cancer 1983, 31, 13-16.
Gerdes J, Lemke H, Baisch H, Wacker HH, Schwab U and Stein H. Cell cycle analysis of a cell proliferation-associated human nuclear antigen defined by the monoclonal antibody Ki-67. J Immunol 1984, 133, 1710-1717.
Giaretti W, Sciallero S, Bruno S, Geido E, Aste H and Di Vinci A. DNA flow cytometry of endoscopically examined colorectal adenomas and adenocarcinomas. Cytometry 1988, 9, 238-44.
Gonchoroff NJ, Greipp PR, Kyle RA, Katzmann JA. A Monoclonal antibody reactive with 5-bromo 2-deoxyuridine that does not require DNA denaturation. Cytometry 1985, 6, 6, 506-512.
Gratzner HG, Monoclonal antibody to 5-bromo and 5-iodo deoxyuridine: a new reagent for detection of DNA replication. Science, 1982, 218, 474-5.
Gray, JW, Dolbeare F, Pallavicini MG, Beisker W and Waldman F. Cell cycle analysis using flow cytometry. Int J Radiat Biol 1986, 49, 2, 237-255.
Gray JW. Monoclonal Antibodies against Bromodeoxyuridine. Editor Cytometry 1985, 6, 6, 499-662.
Gunduz N. The use of FTIC-conjugated monoclonal antibodies for determination of S-phase cells with fluorescence microscopy. Cytometry 1985, 6, 6, 597-601.
Hamilton E and Dobbin J. The validity of the labelling index in tumour studies. Br J Cancer 1985, 51, 15-21.
Hartwell LH and Weinert EA. Checkpoints: controls that ensure the order of cell cycle events. Science 1989, 246, 629-34.
Hattori T and nine other authors. Analysis of DNA ploidy patterns of gastric carcinomas of Japanese. Cancer 1984, 54, 1591-97.
Hayashi Y, Koike M, Matsutani M and Hoshino T. Effects of fixation time and enzymatic digestion on immunohistochemical demonstration of BrdUrd in formalin fixed, paraffin embedded tissue. J Histochem Cytochem 1988, 36, 5, 511-514.
Hedley DW, Friedlander ML, Taylor IW, Rugg CA and Musgrove EA. Method for analysis of cellular DNA content of paraffin-embedded pathological material using flow cytometry. J Histochem Cytochem 1983, 31, 1333-5.
Hedley DW, Rugg CA, and Gelber RD. Association of DNA index and S phase fraction with prognosis of nodes positive early breast cancer. Cancer Res 1987, 47, 4729-35.
Hedley DW, Flow cytometry using Paraffin-embedded tissue. Five years on. Cytometry, 1989, 10, 229-241.
Henderson G.. Chapter "Automation". in Morphometry. 1st Edition. Aherne WA and Dunhill MS. Edward Arnold 1982.
Herzenberg Leonard A, Herzenberg Leonore A and Sweet RG. Fluorescence Activated Cell Sorting. Scientific American March 1976, 108-117.
Higgins GA. Preoperative radiotherapy for colorectal cancer-Veterans Administration group studies. in Controversies in Cancer, Massom Publishing, New York 1979. Chapter 17, 145-153.
Hill BT and Price LA. An experimental biological basis for increasing the therapeutic index of clinical cancer therapy. Annals NYAS 1982, 397, 72-87.
Hill RP. Cellular basis of Radiotherapy. in The Basic Science of Oncology. Editor Tannock I. Elsevier Press 1986, Chapter 15. 237-255.
Hill RP. Experimental Radiotherapy in The Basic Science of Oncology. Editor Tannock I. Elsevier Press 1986, Chapter 16. 256-277.
Hitchcock A, Ellis IO, Robertson JFR, Gilmour A, Bell J, Elston CW and Blamey RW. An observation of DNA ploidy, histological grade and immuno-reactivity for tumour related antigens in primary and metastatic breast carcinoma. J Pathol 1989 159, 129-134.
Hoffman RA. Approaches to multicolour Immunofluorescence measurements. Cytometry 1988, Supplement 3, 18-22.
Holte H, Stokke T, Smeland E, Watt R, Blomhoff HK, Kaalhus O and Ohlsson R. Levels of c-myc protein as analysed by flow cytometry correlate with cell growth potential in malignant B-cell lymphomas. Int J Cancer 1989, 43, 1, 164-70.
Hoshino T, Nagashima T, Murovic J, Levin E, Levin V and Rupp S. Cell kinetic studies of in situ human brain tumours using bromodeoxyuridine. Cytometry 1985, 6, 6, 627-33.
Hoshino T, Prados M, Wilson CB, Kyung GC, Lee K-S, and Davis RL. The prognostic implications of the bromodeoxyuridine labelling index of 182 human intracranial gliomas. J Neurosurg 1989 In press.
Houck DW and Loken MR. Simultaneous analysis of cell surface antigens, BrdUrd incorporation and DNA content. Cytometry 1985, 6, 531-538.
Howard A and Pelc SR. Nuclear incorporation of P-32 as demonstrated by autoradiographs. Exp. Cell Res 1951, 2, 178-87.
Hsu SM, Raine L, Fanger H. The use of avidin-biotin-peroxidase complex (ABC) in immunoperoxidase techniques. A comparison between ABC and unlabelled antibody (PAP) procedures. J Histochem Cytochem 1981, 29, 577-580.
Imaseki H, Hayashi H, Taira M, Ito Y, Tabata Y, Onoda S, Isono K and Tatibana M. Expression of c-myc oncogene in colorectal polyps as a biological marker for monitoring malignant potential. Cancer 1989, 64 (3), 704-9.
Ingvarsson S, Asker C, Axelson H, Klein G and Sumegi J. Structure and expression of B-myc, a new member of the myc gene family. Mol Cell Biol 1988, 8, (8), 3168-74.
Jacobsen AB, Thorud E, Fossa SD, Lunde S, Shoaib MC, Juul NO and Pettersen EO. DNA flow cytometry in metastases and recurrence of malignant melanomas. Virchows Archiv B Cell Pathol 1988, 54, 273-7.
Jones DJ, Moore M and Schofield PF. Prognostic significance of DNA Ploidy in colorectal cancer: a prospective flow cytometric study. Br J Surg 1988, 75, 28-33.
Kallioniemi O-P, Hietonen T, Mattila J, Lehtinen M, Lauslati K and Koivula T. Aneuploid DNA content and high S phase fraction of tumour cells are related to poor prognosis in patients with primary breast cancer. Eur J Cancer Clin Oncol 1987, 23, 277-282.
Karn J, Watson JV, Lowe AD, Green SM and Vedeckis W. Regulation of the cell cycle by c-myc levels. Oncogene 1989, 4, 773-87.
Kartner N and Ling V. Multidrug resistance in cancer. Scientific American March 1989, 26-33.
Kaufman ER. Altered CTP synthetase activity confers resistance to 5-bromodeoxyuridine toxicity and mutagenesis. Mutation Research 1986, 161, 19-27.
Kaufman SJ and Nicoud MR. DNA Replication and differentiation in rat myoblasts studied with monoclonal antibodies against BrdUrd, Actin and alpha-2-macroglobulin. Cytometry, 1985, 6, 570-577.
Khan S, Raza A, Petrelli N and Mittleman A. In vivo determinations of labelling index of metastatic colorectal carcinoma and normal colonic mucosa using intravenous infusions of bromodeoxyuridine. J Surg Oncol 1988, 39, 114-8.
Kikuyama S, Kubota T, Watanabe M, Isobe Y, Fukutomi T, Ishibiki K and Abe O. Cell kinetic analysis of human tumour xenografts using anti BrdUrd antibody. Japan J Surg 1987, 17, 1, 28-32.
Kikuyama S, Kubota T, Watanabe M, Ishibiki K and Abe O., Cell kinetic study of human carcinomas using bromodeoxyuridine. Cell Tissue Kinet 1988, 21, 15-20.
Kinsella TJ, Russo A and Mitchell JB. The use of halogenated thymidine analogues as clinical radiosensitisers: rationale, current status and future prospects. Int J Radiol Oncol Biol Phys 1984, 10, 69-76.
Kohler G and Milstein C. Continuous cultures of fused cells secreting antibody of pre-defined specificity. Nature 1975, 256, 495-7.
Kummermehr J and Trott K-R. Rate of repopulation in a slow and fast growing mouse tumour. In Karcher KH, Editor. Progress in Radio-oncology II, Raven Press New York. 1982, 299-308.
Kusama S, Spratt JS, Donegan WL, Watson FR, and Cunningham C. The gross rates of growth of human mammary carcinoma. Cancer 1972, 30, 594-9.
Kute TE and seven coauthors. Relationship of steroid receptor, cell kinetics and clinical status in patients with breast cancer. Cancer Res 1981, 41, 3524-9.
patients with breast cancer. Cancer Res 1981, 41, 3524-9.
Laird AK, Dynamics of tumour growth. Brit J Cancer 1964, 18, 490-502.
Lampe HB, Flint A, Wolf GT, and McClatchey KD. Flow Cytometry: DNA analysis of squamous cell carcinoma of the upper aerodigestive tract. J Otolaryngol 1987, 16, 6, 371-6.
Laskey RA, Fairman MP and Blow JJ. S phase of the cell cycle. Science 1989, 246, 609-14.
Latt SA, George YS, Gray JW. Flow cytometric analysis of BrdUrd substituted cells stained with 33258 Hoechst. J Histochem Cytochem 1977, 25, 927.
Lee and Nurse. A human protein acting early in G1 which commits cells to the mitotic cycle. Nature 327, 1987, 31-33.
Lelle R, Heidenreich W, Stauch G and Gerdes J. The correlation of growth fractions with histologic grading and lymph node status in human mammary carcinoma. Cancer 1987 59, 83-88.
Lightdale C, Lipkin M and Deschner E. In vivo measurements in familial polyposis. kinetics and location of proliferating cells in colonic adenomas. Cancer Res 1982, 42, 4280-4283.
Lincoln ST and Bauer KD. Limitations in the measurement of c-myc oncoprotein and other nuclear antigens by flow cytometry. Cytometry 1989, 10, 456-462.
Lipkin M, Bell B, Sherlock P. Cell proliferation kinetics in the gastrointestinal tract of man. Gastroenterology, 1963, 45, 721-9.
Lipkin M. Cell cycle and cancer, Decker, New York 1971, 1-26.
Lipkin M and Higgins P. Biological markers of cell proliferation and differentiation in human gastro-intestinal diseases. Advances in Cancer Research 1988, 50, 1-24.
Lipkin M. Biomarkers of increased susceptibility to gastrointestinal cancer. New application to studies of cancer prevention in human subjects. Cancer Res 1988, 48, 235-45.
Liu KC and Wright NA. Are there differences in the cell cycle of normal and malignant cells? Int J Radiat Biol 1986, 49, 2, 297-306.
Lloyd D, Review Article. Biochemistry of the cell cycle. Biochem J 1987, 242, 313-321.
Locker AP and seven coauthors. C-myc oncogene product expression and prognosis in operable breast cancer. Br J Cancer 1989, 60, 669-72.
Lord BI. Controls on the cell cycle. Int J Radiat Biol 1986, 49, 2, 279-296.
MacIntosh JR and Koonce MP. Mitosis. Science 1989, 246, 622-29.
Macartney JC, Camplejohn RS and Powell G. DNA flow cytometry of histological material from human gastric cancer. J Pathol 1986, 148, 273-277.
Macartney JC and Camplejohn RS. DNA flow cytometry of histological material from dysplastic lesions of human gastric mucosa. J Pathol 1986, 150, 113-118.
Malaise EP, Chavaudra N and Tubiana M. The relationship between the growth rate, labelling index and histological type of human solid tumours. Eur J Cancer 1973, 9, 305-12.
Mann RC. On multiparameter data analysis in flow cytometry. Cytometry 1987, 8, 184-189.
Masters JRW, Camplejohn RS, Millis RR and Rubens RD. Histological grade, elastosis, DNA ploidy and the response to chemotherapy of breast cancer. Br J Cancer 1987, 55, 455-7.
Mauro F, Gohde W, Schumann J, Teodori L and Spano M. Considerations in the design of possible cell cycle effective drugs. Int J Radiat Biol 1986, 49, 2, 307-333.
Mayall BH. Current capabilities and clinical applications of Image Cytometry. Cytometry 1988, Suppl 3, 78-84.
McDivitt RW, Stone KR and Meyer JS. A method for dissociation of viable human breast cancer cells that produce flow cytometric kinetic information similar to that obtained by thymidine labelling. Cancer Research 1984, 44, 2628-33.
McDivitt RW, Stone KR, Craig RB, Palmer JO, Meyer JS and Bauer WC. A proposed classification of breast cancer based on kinetic information. Cancer 1986, 57, 269-76.
McGregor AM. Monoclonal antibodies: production and use. Brit Med J 1981, 283, 1143-4.
McGurrin J, Doria M, Dawson P, Karrison T, Stein H and Franklin W. Assessment of tumour cell kinetics by immunohistochemistry in carcinoma of the breast. Cancer 1987, 59, 1744-50.
Meyer JS, Nauert J, Koehm S and Hughes J. Cell kinetics of human tumours by in vitro bromodeoxyuridine labelling. J Histochem Cytochem 1989, 37, 9, 1449-54.
Meyer JS, Friedman E, McCrate M and Bauer WC. Prediction of the early course of breast cancer by thymidine labelling. Cancer 1983, 51, 1879-86.
Meyer JS and Prioleau PG. S-phase fractions of colorectal carcinomas related to pathologic and clinical features. Cancer 1981, 48, 1221-1228.
Meyer SD. Cell kinetic measurements of human tumours. Human Path 1982, 13, 10, 874-877.
Michelson S, Glicksman AS and Leith JT. Growth in solid heterogenous human colon adenocarcinomas. comparison of simple logistical models. Cell Tissue Kinet 1987, 20, 343-355.
Miller MR, Heyneman C, Walker S and Ulrich RG. Interaction of monoclonal antibodies directed against bromodeoxyuridine with pyrimidine bases, nucleosides and DNA. J Immunol 1986, 136, 5, 1791-5.
Miltenburger HG, Sachse G and Schliermann M. S-phase detection with a monoclonal antibody. Devel Biol Standard Karger, Basel 1987, 66, 91-99.
Mitchell JB, Morstyn G, Russo A, Kinsella TJ, Fornace A, McPherson S and Glatstein E. Differing sensitivity to fluorescent light in Chinese hamster cells containing equally incorporated quantities of BrdUrd versus IrdUrd. Int J Radiation Oncol Biol Phys 1984, 10, 1447-1451.
Moran RE. Black MM, Alpert L and Straus MJ. Correlation of cell kinetics, hormone receptors, histopathology and nodal status in human breast cancer. Cancer 1984, 54, 1586-90.
Murray AW and Kirschner MW. Dominoes and clocks. the union of two views of the cell cycle. Science 1989, 246, 614-21.
Muto T, Bussey HJR and Morson BC. The evolution of cancer of the colon and rectum. Cancer 1975, 36, 2251-70.
Nemoto R, Hattori K, Sasaki A, Miyanaga N, Koiso K and Harada M. Estimations of the S phase fraction in situ in transitional cell carcinoma of the renal pelvis and ureter with bromodeoxyuridine labelling. Brit J Urol 1989, 64, 339-344.
Nemoto R, Uchida K, Hattori K, Shimazui T, Nishijima Y, Saito S, Koiso K and Harada M. S phase fraction of human bladder tumour measured in situ with bromodeoxyuridine labelling. J Urol 1988, 139, 286-289.
Nemoto R, Uchida K, Hattori K, Shimazui T, Koiso K and Harada M. Immunochemical demonstration of S phase cells by anti-bromodeoxyuridine monoclonal antibody in human prostate adenocarcinoma. J Urol 1989, 141, 337-40.
Nicolson G. Cancer Metastasis. Scientific American. March 1979, 50-60.
Nicholson S, Sainsbury JRC, Halcrow P, Harris AL and Farndon JR. Epidermal Growth Factor Receptor expression and prognosis— A six year follow up of patients with operable breast cancer. Abstract to the British Association of Surgical Oncology, Guildford, UK. December 1989.
Nordenskjold B, Zetterberg A and Loyhagen T. Measurement of DNA synthesis by 3H-thymidine incorporation into needle aspirates from human tumours. Acta Cytologica 1974, 18, 215-221.
Nordlingo S, Collan Y, Eskelinen M. DNA measurement of archival specimens in the evaluation of breast carcinoma. Cytometry (Suppl). 1988, 2, 50.
Norton L. Thoughts on a role for cell kinetics in cancer chemotherapy. Controversies in Cancer. Masson Publishing USA Inc. 1979, 105-115
Oakland DJ. The diagnosis of carcinoma of the colon by exfoliative cytology. Proc Roy Soc Med 1964, 57, 279-282.
Odegaard S, Hostmark J, Skagen DW, Schrumpf E and Laerum OD. Flow cytometric DNA studies in normal gastric mucosa, gastritis and resected stomachs. Scand J Gastroenterol 1987, 22, 750-756.
Odegaard S, Hostmark J, Skagen DW, Schrumpf E and Laerum OD. Flow cytometric DNA studies in human gastric cancer and polyps. Scand J Gastroenterol 1987, 22, 1270-76.
Ogata K, Kurki P, Celis JE, Nakamura RM and Tan EM.. Monoclonal antibodies to a nuclear protein (PCNA/Cyclin) associated with DNA replication. Exp cell Research 168, 1987, 475-486.
O'Reilly SM and Richards MA. Node negative breast cancer. BMJ 1990, 300, 346-8.
Ota DM and Drewinko B. Growth kinetics of human colorectal carcinoma. Cancer Research 1985, 45, 2128-2131.
Pallavicini MG, Summers L, Dolbeare F and Gray JW. Cytokinetic properties of asynchronous and ara-C perturbed murine tumours measured by simultaneous BrdUrd/DNA analysis. Cytometry 1984, 6, 602-610.
Papa S, Vitale M, Mazzotti G, Rizzoli R, Falconi M, Bartoletti A and Manzoli FA. Gradient fractionation of cycling and resting cells monitored by BrdUrd incorporation. Histochemistry 1988, 89, 241-5.
Pardee AB. A restriction point for control of normal animal cell proliferation. Proc Nat Acad Sci USA 1974, 71, 1286.
Pardee AB, Campisi J and Croy RG. Differences in growth regulation of normal and tumour cells. Annals NYAS 1982, 397, 121-129.
Pardee AB. G1 events and regulation of cell proliferation. Science 1989, 246, 603-8.
Peters LJ, Brock WA, Chapman JD and Wilson GD. Predictive assays of tumour radiocurability. Am.J.Clin.Oncol(CCT) 11, 3, 275-287, 1988.
Petersen SE, Bichel P and Lorentzen M. Flow cytometric demonstration of tumour cell subpopulations with different DNA content in human colorectal carcinoma. Eur J Cancer, 1978, 15, 383-6.
Pollack A, Moulis H, Prudhomme DL, Block NL and Irvin GL. Flow cytometric analysis of cell kinetic responses using measurements of correlated DNA and nuclear protein. Annals NYAS 1986, 468, 55-66.
Poste G. Cellular heterogeneity in malignant neoplasms and the therapy of metastases. Annals NYAS, 1982, 397, 34-48.
Prescott DM. Control of the initiation of DNA synthesis. Annals NYAS 1982, 397, 101-109.
Quirke P, Dixon MF, Day DW, Fozard JBJ, Talbot IC and Bird CC. DNA aneuploidy and cell proliferation in familial adenomatous polyposis. Gut, 1988, 29, 603-607.
Raffel C, Deen DF and Edwards MSB. Bromodeoxyuridine, a comparison of its photosensitising and radiosensitising properties. J Neurosurg 1988, 69, 410-15.
Raymond W and Leong A. The relationship between growth fractions and oestrogen receptors in human breast carcinoma, as determined by immunohistochemical staining. J Pathol 1989, 158, 203-211.
Raymond W and Leong A. Vimentin: a new prognostic parameter in breast carcinoma. J Pathol 1989, 158, 107-114.
Raza A, Ucar K and Preissler HD. Double labelling and in vitro versus in vivo incorporation of Bromodeoxyxuridine in patients with Acute nonlymphocytic leukemia. Cytometry 1985, 6, 6, 633-41.
Riccardi A, Danova M, Wilson GD, Ucci G, Dormer P, Mazzini G, Brugnatelli S, Girino M, McNally N and Ascari E. Cell Kinetics in Human malignancies studied with in vivo administration of Bromodeoxyuridine and Flow Cytometry. Cancer Research, 1988, 48, 6238-6245.
Riccardi A and 10 coauthors. Cell kinetics in human malignancies studied with in vivo administration of bromodeoxyuridine and flow cytometry. Br J Cancer 1989, 59, 898-903.
Rice G, Laszlo A, Li G, Gray J and Dewey W. Heat shock proteins within the mammalian cell cycle, relationship to thermal sensitivity, thermal tolerance and cell cycle progression. J Cell Physiol 1986, 126, 291-297.
Risio M, Coverlizza S, Ferrari A, Candelaresi GL and Rossini FP. Immunohistochemical study of epithelial cell proliferation in hyperplastic polyps, adenomas, and adenocarcinomas of the large bowel. Gastroenterology 1988, 899-906.
Roenn JHV, Kheir S, Wolter JM and Coon JS. Significance of DNA abnormalities in primary malignant melanoma and naevi. A retrospective flow cytometric study. Cancer Research 1986, 46, 3192-3195.
Ronot X and Adolphe M. Update on the concept of the cell cycle: the contribution of flow cytometry. Biology of the Cell, Elsevier, Paris 1986, 58, 113-120.
Rosenberg IL, Russell CW, and Giles GR. Cell viability studies on the exfoliated colonic cancer cell. Br J Surg 1978, 65, 188-190.
Rotenberg M (Editor). Biomathematics and cell kinetics. Elsevier Biomedical Press, New York 1981.
Sainsbury JRC, Farndon JR, Needham GK et al. Epidermal Growth Factor receptor status as a predictor of early recurrence of and death from breast cancer. Lancet 1987, 1, 1598-1402.
Sasaki K, Matsumura K, Tsuji T, Shinozaki F, and Takahashi M. Relationship between Labelling indices of Ki-67 and BrdUrd in human malignant tumours. Cancer 1988, 62, 989-993.
Sasaki K, Murakami T, Kawasaki M and Takahashi M. The cell cycle associated change of the Ki-67 reactive nuclear antigen expression. J Cell Physiol 1987, 133, 579-584.
Sasaki K, Ogino T and Takahashi M. Immunological determination of labelling index on human tumour tissue sections using monoclonal anti-BrdUrd antibody. Stain Technol 1986, 61, 155-161.
Sasaki K, Murakami T, Takahashi M. A rapid and simple estimation of cell cycle parameters by continuous labelling with BrdUrd. Cytometry 1987, 8, 526-8.
Schwarting R, Gerdes J, Niehus J, Jaeschke L and Stein H.. Determination of the growth fraction in cell suspensions using the monoclonal antibody Ki-67. Journal of Immunological methods 1986, 90, 65-70.
Schutte B, Reynders M, Van Asche C, Hupperets P, Bosman FT and Blijham GH. An improved method for immunocytochemical detection of BrdUrd labelled nuclei using flow cytometry. Cytometry 1987, 8, 372-6.
Sciallero S, Bruno S, Geido E, Aste H, Di Vinci A and Giaretti W. Flow cytometric DNA ploidy in colorectal adenomas and family history of colorectal cancer. Cancer 1988, 61, 114-20.
Scott NA and Beart RW. Colorectal Cancer: flow cytometric DNA analysis. Aust NZ J Surg 1988, 58, 189-91.
Serafini EP, Kirk AP and Chambers TJ. Rate and pattern of epithelial cell proliferation in ulcerative colitis. Gut, 1981, 22, 648-52.
Shepherd NA, Richman PI and England J. Ki-67 derived proliferative activity in colorectal adenocarcinoma with prognostic correlations. J Pathol 1988, 155, 213-9.
Shibui S, Hoshino T, Vanderlaan M and Gray JW. Double labelling with iodo- and bromodeoxyuridine for cell kinetics studies. J Histochem Cytochem 1989, 37, 7, 1007-11.
Shimosato Y, Asamura H, Katsuaki Y, Noguchi M, Nakajima T and Mukai K. DNA content and Bromodeoxyuridine labelling index in adenocarcinoma of the lung. Chest 1989, 96, 1, 37-38.
Sikora K, Chan S, Evan G, Gabra H, Markham N, Stewart J and Watson JV. c-myc oncogene expression in colorectal cancer. Brit J Cancer 1987, 59, 1289-95.
Silvestrini R, Daidone M and Gasparini G. Cell kinetics as a prognostic marker in node negative breast cancer. Cancer 1985, 56, 1982-7.
Simpson-Herren L. Kinetic perturbations during cancer therapy. Annals NYAS 1982, 397, 88-100.
Skipper HE, Schabel FM, Wilcox WS. Experimental evaluation of potential anti-cancer agents XII. On the criteria and kinetics associated with curability of experimental leukemia. Cancer Chemother Rep 1964, 35, 1-111.
Sklaress RS, Hoffman J and Post J. A rapid in vitro method for measuring cell proliferation in human breast cancer. Cancer 1977, 40, 2299-2302.
Smallwood JA. The application of the stem cell assay in human breast carcinoma. Thesis, the University of Southampton, 1985.
Stearns MW. Preoperative radiotherapy in rectal cancer. Controversies in cancer. Masson Publishing USA Inc 1979. Chapter 18, 155-160.
Steel GG. Growth kinetics of tumours. Oxford University Press, London 1977.
Steel GG. Autoradiographic analysis of the cell cycle. Int J Radiat Biol 1986, 49, 2 227-235.
Stewart J, Evan G, Watson JV and Sikora K. Detection of the c-myc oncogene product in colonic polyps and carcinomas. Brit J Cancer 1986, 53, 1-6.
Stokke T, Holte H, Erikstein B, Steen HB. Intracellular localisation of DNA polymerase alpha. Cytometry (Suppl) 1988, 2, 72-5.
Straus MJ, Moran RE. The cell kinetics of human breast cancer. Cancer 1980, 46, 2634-9
Stuart-Harris R, Hedley DW, Taylor IW, Levene AL, Smith IE. Tumour ploidy, response and survival in patients receiving endocrine therapy for advanced breast cancer. Brit J Cancer 1985, 51, 573-6.
Studzinski GP, BrelviZS, Feldman SC and Watt RA. Participation of c-myc in DNA synthesis of human cells. Science 1986, 234, 467-70.
Sundaresan V, Forgacs IC, Wight DGD, Wilson B, Evan GI and Watson JV. Abnormal distribution of c-myc oncogene product in familial adenomatous polyposis. J Clin Pathol 1987, 40, 1274-81.
Sunter JP, Wright NA, Appleton DR. Cell population kinetics in the epithelium of the colon of the male rat. Virchows Arch B (Cell Path) 1978, 26, 275-287.
Sunter JP, Watson AJ, Wright NA, Appleton DR. Cell proliferation at different sites along the length of the rat colon. Virchows Arch B (Cell Path) 1979, 32, 75-87.
Tada T, Kodama T, Watanabe S, Sato Y and Shimosato Y. Immunohistochemical cell kinetic study of human lung cancer by using monoclonal antibody to bromodeoxyuridine. Jpn J Clin Oncol 1986, 16, 2, 129-35.
Tannock I,. Cell kinetics and chemotherapy, a critical review. Cancer Treat Rep 1978, 62, 1117-1133.
Tannock I. Experimental chemotherapy and concepts related to the cell cycle. Int J Radiat Biol 1986, 49, 2, 335-355.
Taub RM, Moulding C, Battey J et al. Activation and somatic mutation in the translocated c-myc gene in Burkitt's lymphoma. Cell 1984, 36, 339-348.
Taylor I, Machin D, Mullee M, Trotter G, Cooke T and West C. A randomised controlled trial of adjuvant portal vein cytotoxic perfusion in colorectal cancer. Br J Surg 1985, 72, 359-63.
Taylor JH, Woods PS, Hughes WL. The organisation and duplication of chromosomes using tritiated thymidine. Proc Nat Acad Sci USA, 1957, 43, 122-8.
ten-Kate J, Eidelman S, Bosman FT and Damjanov I. Expression of the c-myc proto-oncogene in normal human intestinal epithelium. J Histochem Cytochem 1989, 37 (4), 541-5.
Teodori L, Danesi DT, Cordelli E et al. Potential prognostic significance of cytometrically determined DNA abnormality in GI tract human tumours. Annals NYAS 1986, 468, 291-301.
Terpstra OT, Blankenstein MV, Dees J and Eilers GAM. Abnormal pattern of cell proliferation in the entire colonic mucosa of patients with colon adenoma or cancer. Gastroenterology 1987, 92, 704-8.
Toikkanen S, Eerola E, Ekfors TP. Pure and mixed mucinous breast carcinomas. DNA stemline and prognosis. J Clin Pathol 1988, 41, 300-3.
Toikkanen S, Joensuu H and Klemi P. The prognostic significance of nuclear DNA content in invasive breast cancer- a study with long term follow-up. Br J Cancer 1989, 60, 693-700.
Trent JM, Gerner E, Broderick R and Crossen PE. Cell cycle analysis using BrdUrd. comparison of methods for analysis of total cell transit time. Cancer Genet Cytogenet 19, 1986, 43-50.
Trotter G, A review of the cell kinetics of colorectal carcinomas. MS Thesis, University of Southampton, 1986.
Tubiana M and Courdi A. Cell proliferation kinetics in human solid tumours: relation to probability of metastatic dissemination and long term survival. Radiotherapy and Oncology 1989, 15, 1-18.
Tubiana M. The kinetics of tumour cell proliferation and radiotherapy. Brit J Radiol 1971, 44, 325-347.
Tubiana M, Pejovic MJ, Renaud A, Contesso G, Chavaudra N, Gioanni J and Malaise EP. Kinetic parameters and the course of the disease in breast cancer. Cancer 1981, 47, 937-943.
Umpleby HC, Fermor B, Symes MO and Williamson RCN. Viability of exfoliated colorectal carcinoma cells. Br J Surg 1984, 71, 659-663.
Van den Berg FM, Tigges AJ, Schipper MEJ, den Hartog-Jager FCA, Kroes WGM and Walboomers JMM. Expression of the nuclear oncogene p53 in colon tumours. J Pathol 1989, 157, 193-9.
Vanderlaan M and Thomas CB. Characterisation of monoclonal antibodies to bromo deoxyuridine. Cytometry 6, 6, 1985, 501-505.
Van Dierendonck JH, Keyzer R, Van de Velde C, and Cornelisse CJ. Subdivision of the S phase by analysis of Nuclear 5-BrdUrd staining patterns. Cytometry 10, 1989, 143-150.
Van Kuenen-Boumeester, Blonk DI and Van der Kwast Th. Immunocytochemical staining of proliferating cells in fine needle aspiration smears of primary and metastatic breast tumours. Br J Cancer 1988, 57, 509-511.
Van Putten LM. Cell Kinetics, a guide for chemotherapy? Controversies in Cancer, Chapter 13. Masson Publishing New York 1979, 117-9.
Vogelstein B and nine other authors. Genetic alterations during colorectal tumour development. New Eng J Med 1988, 319, 9, 525-532.
Waldman FM, Dolbeare F and Gray J. Clinical applications of the Bromodeoxyuridine/DNA assay. Cytometry 1988, Suppl 3, 65-72.
Waldman F, Dolbeare F, Gray JW. Detection of Ara-C resistant cells at low frequency using the BrdUrd/DNA assay. Cytometry 1985, 6, 657-662.
Walker RA and Camplejohn RS. Comparison of monoclonal antibody Ki67 reactivity with grade and DNA flow cytometry of breast carcinomas. Br J Cancer 1988, 57, 281-3.
Walker RA, Senior PV, Jones JL, Critchley DR and Varley JM. An immunohistochemical and in situ hybridization study of c-myc and c-erbB-2 expression in primary human breast carcinomas. J Pathol 1989, 158, 97-105.
Watson JV. The cell proliferation kinetics of the EMT6/M/AC mouse tumour at 4 volumes during unperturbed growth in vivo. Cell Tissue Kinet 1976, 9, 147-156.
Watson JV. Oncogenes, Cancer and Analytical Cytology. Cytometry 1986, 7, 400-410.
Watson JV, Stewart J, Evan GI, Ritson A, Sikora K. The clinical significance of flow cytometric c-myc oncoprotein quantitation in testicular cancer. Br.J.Cancer 1986, 53, 331-337.
Watson JV. Flow cytometry in biomedical science. Nature 1987, 325, 741-2.
Watson JV, Stewart J, Cox C, Sikora K and Evan GI. Flow cytometric quantitation of the c-myc oncoprotein in archival neoplastic biopsies of the colon. Molecular and cellular probes 1987, 1, 151-7.
Watson JV, Chambers SH and Smith PJ. A pragmatic approach to the analysis of DNA histograms with a definable G1 peak. Cytometry, 1987, 8, 1-8.
Watson JV, Time, a quality control parameter in flow cytometry.. Cytometry 1987, 8, 646-649.
Watson JV. Quantitation of molecular and cellular probes in populations of single cells using fluorescence. Molecular and cellular probes 1987, 1, 121-136.
Weinberg R. A Molecular basis of Cancer. Scientific American November 1983, 102-116.
Welin S, Youker J and Spratt JS. The rates and patterns of growth of 375 tumours of the large intestine and rectum observed serially by double contrast enema study (Malmo technique). Am J Roentgenol 1963, 90, 673-687.
Wilson GD, McNally NJ, Dunphy E, Karcher H, Pfrager R. The labelling index of human and mouse tumours assessed by BrdUrd staining in vitro and in vivo and flow cytometry. Cytometry 1985, 6, 641-7.
Wilson GD, McNally NJ, Dische S, Saunders MI, Des Rochers C, Lewis AA and Bennett MH. Measurement of cell kinetics in human tumours in vivo using bromodeoxyuridine incorporation and flow cytometry. Br.J.Cancer 1988, 58, 423-431.
Witzig TE and 8 co-authors. Rapid S phase determination of non-Hodgkins lymphomas with the use of an immunofluorescence bromodeoxyuridine labelling index procedure. Am J Clin Pathol 1989, 91, 3, 298-301.
Wolberg WH and Ansfield FJ. The relationship of the thymidine labelling index in human tumours in vitro to the effectiveness of 5 fluorouracil chemotherapy. Cancer Res 1971, 81, 448-50.
Wolberg WH and Brown RR. Autoradiographic studies of in vitro incorporation of uridine and thymidine by human tumour tissue. Cancer Research 1962, 22, 1113-1119.
Wolley RC, Schreiber K, Kloss LG et al. A DNA distribution of human colon carcinoma and its relationship to clinical behaviour. J Nat Cancer Inst 1982, 69, 15-22.
Woodruff MFA. Tumour clonality and its biological significance. Advances in Cancer Research 1988, 50, 197-229.
Wright N and Alison M. The Biology of Epithelial Cell Populations Volumes I and II. Oxford Science Publications, Clarendon Press 1984.
Wright NA, Britton DR, Bone G and Appleton DR. Cell proliferation in gastric carcinoma. A stathmokinetic study. Cell and Tissue Kinet 1977, 10, 429-438.
Wright WE. BUdR, Probability and cell variants. Towards a molecular understanding of the decision to differentiate. BioEssays 1986, 3, 6, 245-7.
Wyatt JI, Quirke P, Ward DC, Clayden AD, Dixon MF, Johnston D and Bird CC. Comparison of histopathological and flow cytometric parameters in the prediction of prognosis in gastric cancer. J Pathol 1989, 158, 195-201.
Wynford-Thomas D and Williams ED. Use of Bromodeoxyuridine for cell kinetic studies in intact animals. Cell Tissue Kinet 1986, 19, 179.
Yanagisawa M, Dolbeare F, Todoroki T and Gray JW. Cell Cycle analysis using numerical simulation of bivariate DNA/BrdUrd distributions. Cytometry 1985, 6, 550-562.
Yonemura Y and eight coauthors. Correlation of DNA ploidy and proliferative activity in human gastric cancer. Cancer 1988, 62, 8, 1497-502.
Yonemura Y and eight coauthors. Epidermal growth factor receptor status and S phase fractions in gastric carcinoma. Oncology 1989, 46, 3, 158-61.
Young RC and DeVita VT. Cell cycle characteristics of human solid tumours in vivo. Cell Tissue Kinet 1970, 3, 285-290.
Zetterberg A, Engstrom W, Larsson O. Growth activation of resting cells. Annals NY Acad Sci, 1982, 397, 130-147.
The following published papers were included in the bound thesis. These have not been digitised due to copyright restrictions, but the links are provided.
https://doi.org/10.1002/bjs.1800780120

Figure 1:1. The cell cycle is often depicted in circular form. This diagram emphasises the change in DNA content through the cycle. Each daughter cell reenters G1 after Mitosis.

Figure 1:2. The mathematical relationships of the potential doubling time, the cell cycle time and the actual volume doubling time are shown. n is the number of cells and t is the time (hours or days).
